Read more about the article Double Top Reversal
The Double Top Reversal is a classic chart pattern signaling a trend reversal. Learn how to identify this pattern and use it to predict market downturns for better trading decisions.

Double Top Reversal

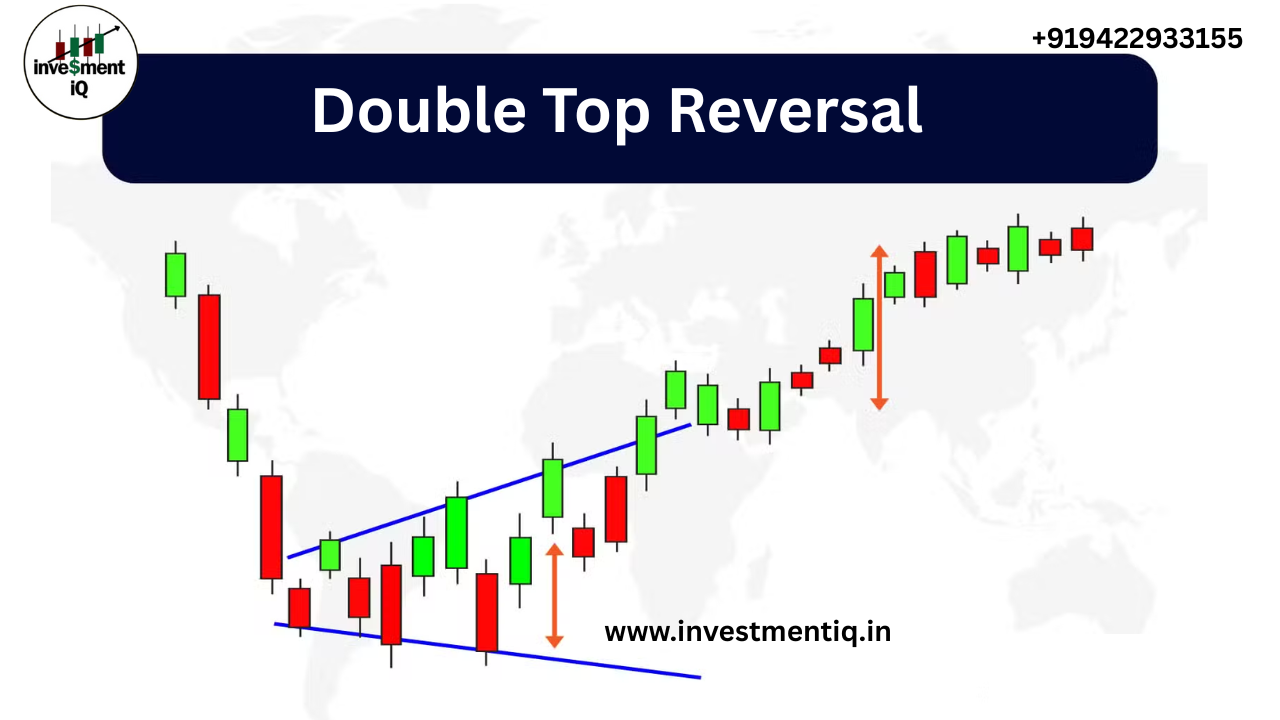
Explore the Double Top Reversal chart pattern and learn to identify, interpret, and trade this common bearish reversal pattern. A common bearish reversal pattern on bar, line, and candlestick charts is the Double Top Reversal.As the name suggests, the pattern consists of two  about equal peaks that are followed by a mild dip. The traditional Double Top Reversal pattern indicates at least an intermediate-term shift from bullish to bearish, though there may be variances. An illustration of a Double Top Reversal can be seen in the chart below. Example of a classic Double Top Reversal…

Continue ReadingDouble Top Reversal
Read more about the article Broadening Top or Megaphone Top
: The Broadening Top, also known as the Megaphone Top, is a chart pattern indicating heightened market volatility. Learn to spot this pattern for potential trend reversals and trading opportunities.

Broadening Top or Megaphone Top

Broadening Top or Megaphone Top What Is a Broadening Top? A chart pattern with a series of higher peaks and lower dips is known as a spreading top. The pattern would seem like a megaphone or a reverse triangle if you were to draw a trendline across the top and bottom of the price movement. What Does the Broadening Top Indicate? Whether it's a broadening top or a broadening bottom, the most trustworthy sign that any broadening formation is telling us is that bullish and bearish investors are at odds with one another. While negative investors sell (or sell short) the stock, causing it to decline, bullish investors are bidding it higher. You consequently witness a string of successive lower lows (LLs) and higher highs (HHs). Are Broadening Tops Bearish or Bullish? While many long-term…

Continue ReadingBroadening Top or Megaphone Top
Read more about the article Chart Patterns
Discover the most effective chart patterns used in technical analysis to predict stock market trends. Learn how to spot reversal and continuation patterns for successful trading.

Chart Patterns

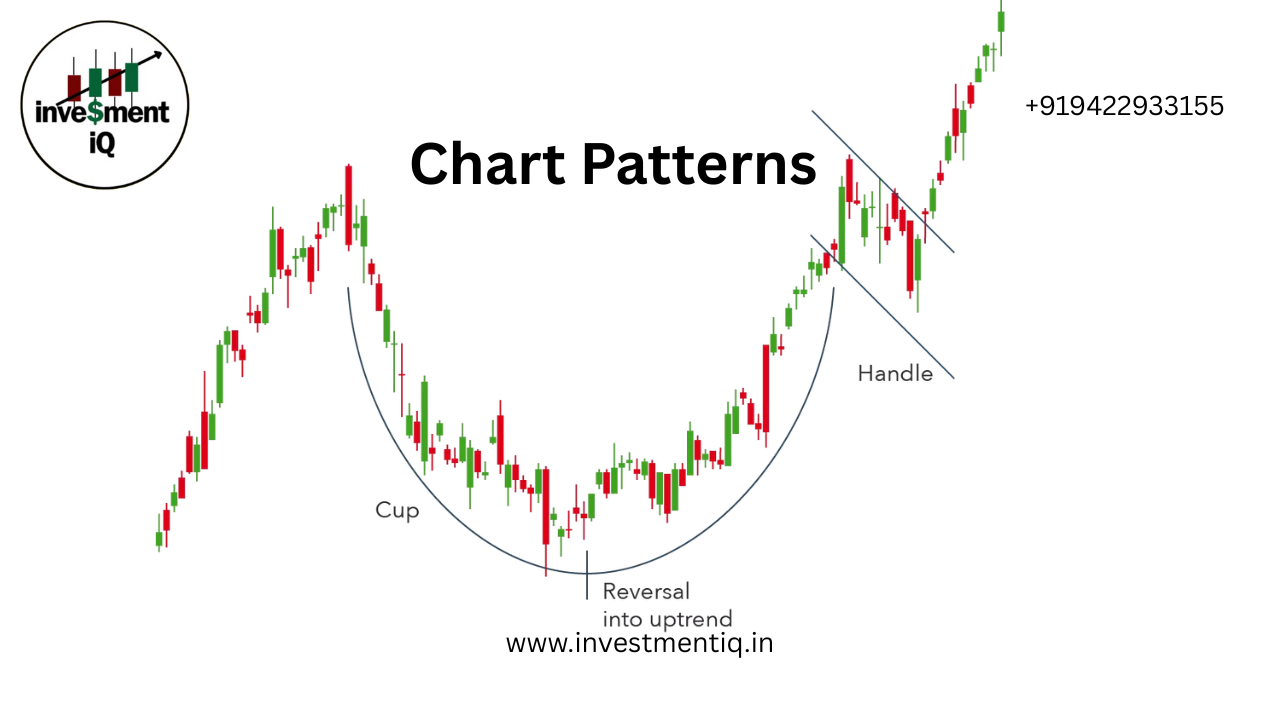
Why Are Chart Patterns Important? The forces of supply and demand drive prices in the financial market. Who is winning—the sellers or the buyers? In order to determine whether a market is heading upward, downward, or sideways, chart patterns offer a visual depiction of the conflict between buyers and sellers. You can make better buying and selling judgments if you are aware of this. Numerous chart designs are available. The majority fall into one of two general categories: continuation patterns or reversal patterns. While continuation patterns suggest the price trend will continue following a brief consolidation, reversal patterns indicate a change in the trend. In the StockCharts platform, you can scan for various chart patterns in the Predefined Scans available in the…

Continue ReadingChart Patterns
Read more about the article What’s the stock market and why is it important?
Understanding the stock market: A key driver of economic growth and investment opportunities.

What’s the stock market and why is it important?

Over half of American workers claim they lack the information necessary to choose and manage investments for their retirement plan, despite the fact that news about the stock market and investing is available every day.¹ If you put your investment knowledge in that category, we’ve got a series of helpful videos and articles for you. We can help you learn the fundamentals, starting with how the stock market operates, even if investing and the stock market may utilize terms you're not familiar with. If you want to learn Beginner’s Guide to…

Continue ReadingWhat’s the stock market and why is it important?

3 Month Market Prediction with MMI

Using Market Mood Index to predict Nifty returns in the 3 months following the Extreme Fear zone. The purpose of MMI is to assist investors in better timing their investments and trades. It is a sentiment indicator that gauges the state of the market right now. The indicator uses a scale of 0 to 100 to indicate the mood of the market. Focusing on zones—buying in high extreme fear (values below 20) and selling in high extreme greed (values above 80)—rather than worrying about the precise value of the MMI is the approach. All of the information regarding MMI and the various feeling zones is available here. This post's goal is to evaluate MMI's ability to forecast market returns in the three months that follow the extreme fear zone. Test Identify the dates when MMI entered extreme…

Continue Reading3 Month Market Prediction with MMI
Read more about the article Market Outlook: How Investors Should Respond to Tariffs, Uncertainty in March
Stay ahead of market volatility in March! Learn how investors can respond to tariffs and economic uncertainty with strategic insights and risk management tips.

Market Outlook: How Investors Should Respond to Tariffs, Uncertainty in March

Key Takeaways Separate signal from noise and focus on fundamentals and valuations. Even after outperforming, we continue to recommend value stocks over growth. Small-cap stocks have failed to deliver but…

Continue ReadingMarket Outlook: How Investors Should Respond to Tariffs, Uncertainty in March