

Using Market Mood Index to predict Nifty returns in the 3 months following the Extreme Fear zone.
The purpose of MMI is to assist investors in better timing their investments and trades. It is a sentiment indicator that gauges the state of the market right now. The indicator uses a scale of 0 to 100 to indicate the mood of the market.
Focusing on zones—buying in high extreme fear (values below 20) and selling in high extreme greed (values above 80)—rather than worrying about the precise value of the MMI is the approach.
All of the information regarding MMI and the various feeling zones is available here. This post’s goal is to evaluate MMI’s ability to forecast market returns in the three months that follow the extreme fear zone.
Test
- Identify the dates when MMI entered extreme fear zone (MMI<20)
- Check returns generated by Nifty in the 3 months following the date when MMI entered the extreme fear zone
Results
The chart below shows all the dates since (March 2012) when MMI dropped below 20 and the returns generated by Nifty in the next three months
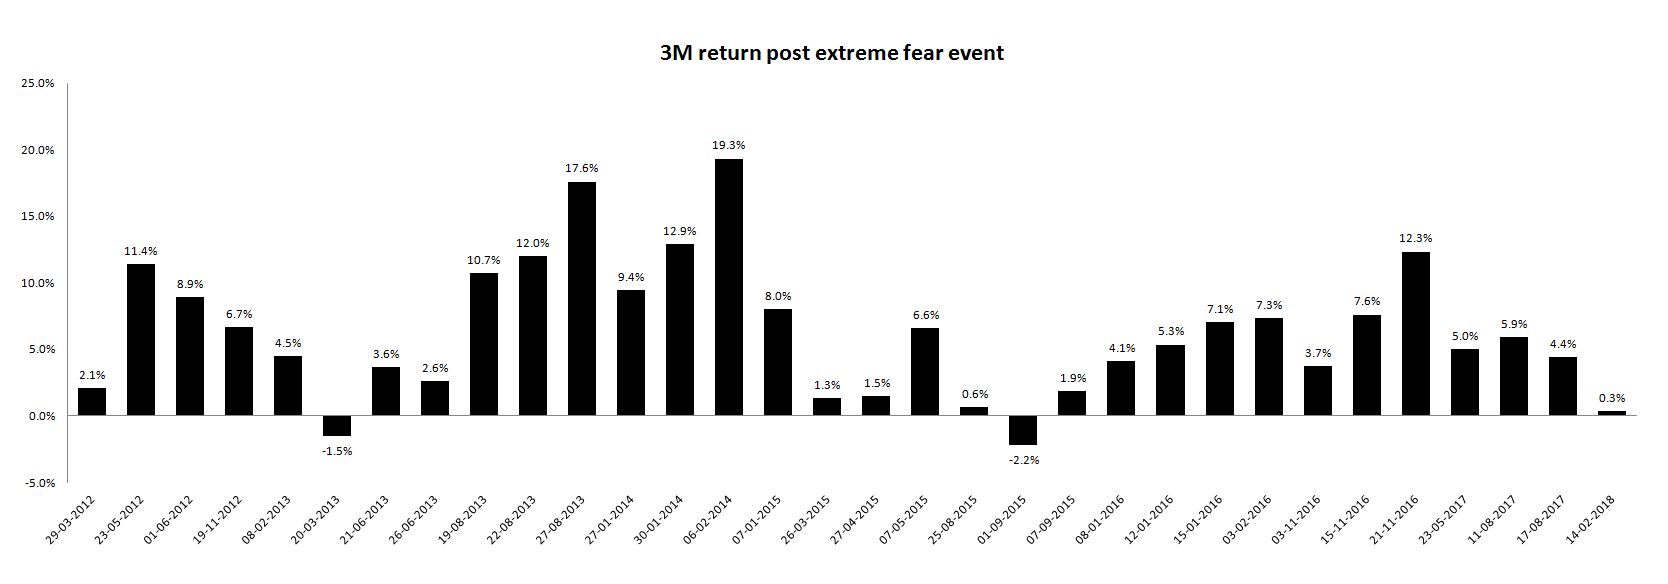
The number of cases where MMI fell below 20 was 32. In the following three months, 30 times Nifty had a positive return out of these 32 situations.This indicates a 93.75% success rate.
In the three months following the MMI falling below 20, the Nifty had an average return of 6.3% and a median return of 5.6%. At 12:21 p.m. on October 24, the MMI is at 22.81. It recently emerged from the zone of acute terror. What transpires this time will be intriguing to observe.
MMI is solely intended to assist investors in better timing the market after they have made the decision to invest; it is not a tool for making trade recommendations. This investigation just identifies one of the several applications for MMI.
you may be interested in this blog here:
