

Introduction
The Matching High pattern is a candlestick formation that traders use to identify potential market peaks. Recognizing this pattern can help you anticipate bearish reversals and make informed trading decisions. This article will explore the Matching High pattern and how to use it effectively in your trading strategy.
What Is the Matching High Pattern?
The Matching High pattern is a two-candlestick formation:
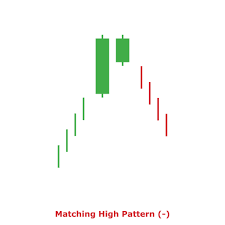
- First Candlestick: The first candlestick is a bullish candle that marks a high point in the market.
- Second Candlestick: The second candlestick opens at or near the close of the first candlestick and forms a new high that matches the high of the first candlestick.
Key Characteristics:
- Appearance: Both candlesticks have similar highs, indicating that buyers are losing control and a potential reversal could be near.
- Context: The pattern generally appears at the end of an uptrend and can signal a potential bearish reversal.
How to Identify and Interpret Matching High
Identification:
- Check the Highs: Ensure that the highs of both candlesticks are approximately equal.
- Examine the Bodies: The bodies of the candlesticks should be relatively small compared to the overall range, indicating indecision and a possible shift in market sentiment.
Interpretation:
- Confirm Reversal: Look for confirmation with a subsequent bearish candlestick or additional technical indicators.
- Volume Analysis: A decrease in volume following the pattern can further validate the potential reversal.
Trading Strategies with Matching High
Setting Entry Points:
- Bearish Entry: Enter a trade when the price moves below the low of the second candlestick in the Matching High pattern, confirming the reversal.
- Confirmation: Ensure that other technical indicators or chart patterns support the bearish signal.
Setting Exit Points:
- Profit Targets: Set profit targets based on support levels or recent lows.
- Stop-Loss Orders: Implement stop-loss orders just above the high of the Matching High pattern to manage risk.
Risk Management:
- Position Sizing: Adjust your position size based on your risk tolerance and the distance between entry and stop-loss levels.
- Diversification: Combine the Matching High pattern with other technical analysis tools to enhance your trading strategy.
Conclusion
The Matching High pattern can be a useful tool for identifying potential market peaks and bearish reversals. By understanding how to recognize and interpret this pattern, and by incorporating it into a comprehensive trading strategy, you can make more informed trading decisions and improve your overall performance.
you may be interested in this blog here:-
Full Stack Development Salary in India – 2024 Trends and Insights
Salesforce Developer Salary in India An In-Depth Analysis
Ultimate Guide to UKG Math Worksheet PDF Free Download
Advanced OOP Concepts in SAP ABAP A Comprehensive Guide


