Introduction: In the dynamic world of financial markets, price trends play a crucial role in guiding investment decisions. Understanding how historical price movements and patterns unfold can provide valuable insights for investors and traders alike. By delving into the nuances of price trends, one can better anticipate market movements and optimize trading strategies.
Section 1: What are Price Trends?

Price trends represent the general direction in which the price of an asset is moving over time. They are fundamental to technical analysis, which focuses on past price movements to predict future trends. Price trends reflect market sentiment and investor behavior, encapsulating the collective actions of market participants.
Section 2: Types of Price Trends

- Uptrend: Characterized by higher highs and higher lows, indicating a bullish market sentiment.
- Downtrend: Marked by lower highs and lower lows, signaling bearish sentiment.
- Sideways (Range-bound) Trend: Occurs when prices fluctuate within a horizontal range, suggesting indecision or consolidation. Examples and graphical representations illustrate how each type manifests in real-market scenarios, providing a visual understanding of trend dynamics.
Section 3: Tools and Techniques for Analyzing Price Trends

Effective analysis of price trends relies on various tools:
Charts and Graphs: Utilized to visualize price movements and identify patterns.
- Technical Indicators: Such as moving averages, Relative Strength Index (RSI), and Moving Average Convergence Divergence (MACD), which help quantify and confirm trends. Explanation on how these tools are applied to interpret trends and make informed trading decisions.
Subsection: Key Technical Indicators Detailed exploration of:
- Moving Averages: Their role in smoothing out price data and identifying trend direction.
- RSI: Measuring the strength of price movements to assess overbought or oversold conditions.
- MACD: Combining trend-following and momentum indicators to confirm trend reversals or continuations. Examples demonstrate how each indicator provides insights into market behavior and potential trading opportunities.
Section 4: Patterns and Formations Discussion of:

- Chart Patterns: Common formations like head and shoulders, triangles, and flags that signal potential trend reversals or continuations.
- Real-world examples and chart illustrations to illustrate the reliability and implications of these patterns.
Section 5: Importance of Volume in Trend Analysis In-depth analysis on:

- Trading Volume: Its significance in validating price trends and identifying shifts in market sentiment.
- How volume analysis complements technical indicators to enhance the accuracy of trend identification and confirmation.
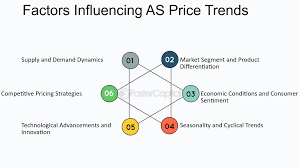
Section 6: Factors Influencing Price Trends Exploration of external factors:

- Economic Data and Events: Impact on market sentiment and price trends.
- Geopolitical Developments: Influence on global markets and asset prices.
- Interplay between fundamental factors (like earnings reports, economic indicators) and technical analysis in shaping price trends.
Section 7: Case Studies and Examples Application of technical analysis tools and principles in:

- Stock Markets: Analysis of recent trends in specific stocks or sectors.
- Forex Markets: Examination of currency pairs and their trend dynamics.
- Cryptocurrency Markets: Insights into volatile price movements and trend patterns. Detailed case studies illustrate how technical analysis aids in understanding market behavior and making strategic trading decisions.
Conclusion: Summarize key takeaways:
- Importance of price trends in guiding investment decisions.
- Role of technical analysis tools in identifying and confirming trends. Encourage readers to apply insights gained to enhance their own trading strategies and decision-making processes.
Call to Action: Invite readers to:
- Explore additional resources or advanced techniques in technical analysis.
- Share their experiences or insights on analyzing price trends in financial markets.
Additional Tips: Enhance readability and engagement:
- Incorporate visual aids such as charts, graphs, and diagrams to illustrate key concepts effectively.
- Provide links to recommended reading materials or online tools for further exploration of technical analysis.


