What is Candlestick?
Beginners guide to candlestick charts a candlestick is a way of displaying information about an asset’s price movement. Candlestick charts are one of the most popular components of technical analysis, enabling traders to interpret price information quickly.
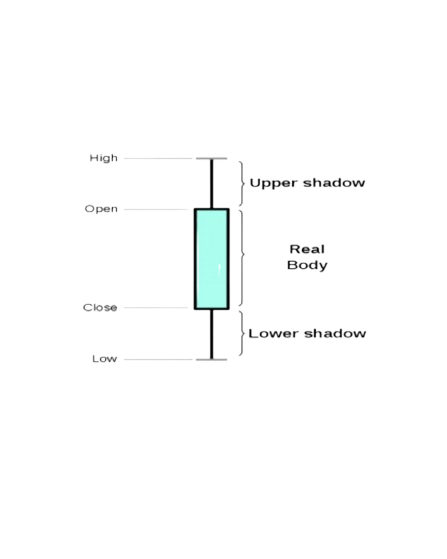
Candlestick has three basic features:
The body represents the open-to-close range.
The Wick, or Shadow, reveals the High and Low of Price for a specific period or day.
The color, which reveals the direction of market movement- a green (or white) body indicates a price increase, while a red (or black) body shows a price decrease.
Candlestick Structure :

Each candlestick on the chart represents the price movement of an asset over a specific period, such as 1 minute, 5 minutes, 1 hour, 1 day, 1 Week, etc. Over time, individual candlesticks form patterns that traders can use to recognize major support and resistance levels.
Origin :
Japanese candlestick chart patterns, the earliest charting technique, originated in the 1700s to forecast rice prices. These charts revolutionized technical analysis, providing insights into market sentiment and future price movements.
Components of a Candlestick:
Open is the price at which the asset is first traded during the specified period.
Close: The price at which the asset closed during the given time frame.
High: The highest price reached during the given time frame.
Low: The lowest price reached during the given time frame.
The candlestick’s shadows show the day’s high and low and how they compare to the open and close. A candlestick’s shape varies based on the relationship between the day’s high, low, opening, and closing prices.
Candlesticks can be classified into two types based on the price movement they represent:

Bullish Candlestick:
If the closing price is higher than the opening price, the candlestick is typically colored green or white. It indicates that buyers were in control during that period, pushing the price up
Bearish Candlestick:
If the closing price is lower than the opening price, the candlestick is typically colored red or black. It indicates that sellers were in control during that period, pushing the price down.

Types of Candlestick Patterns:
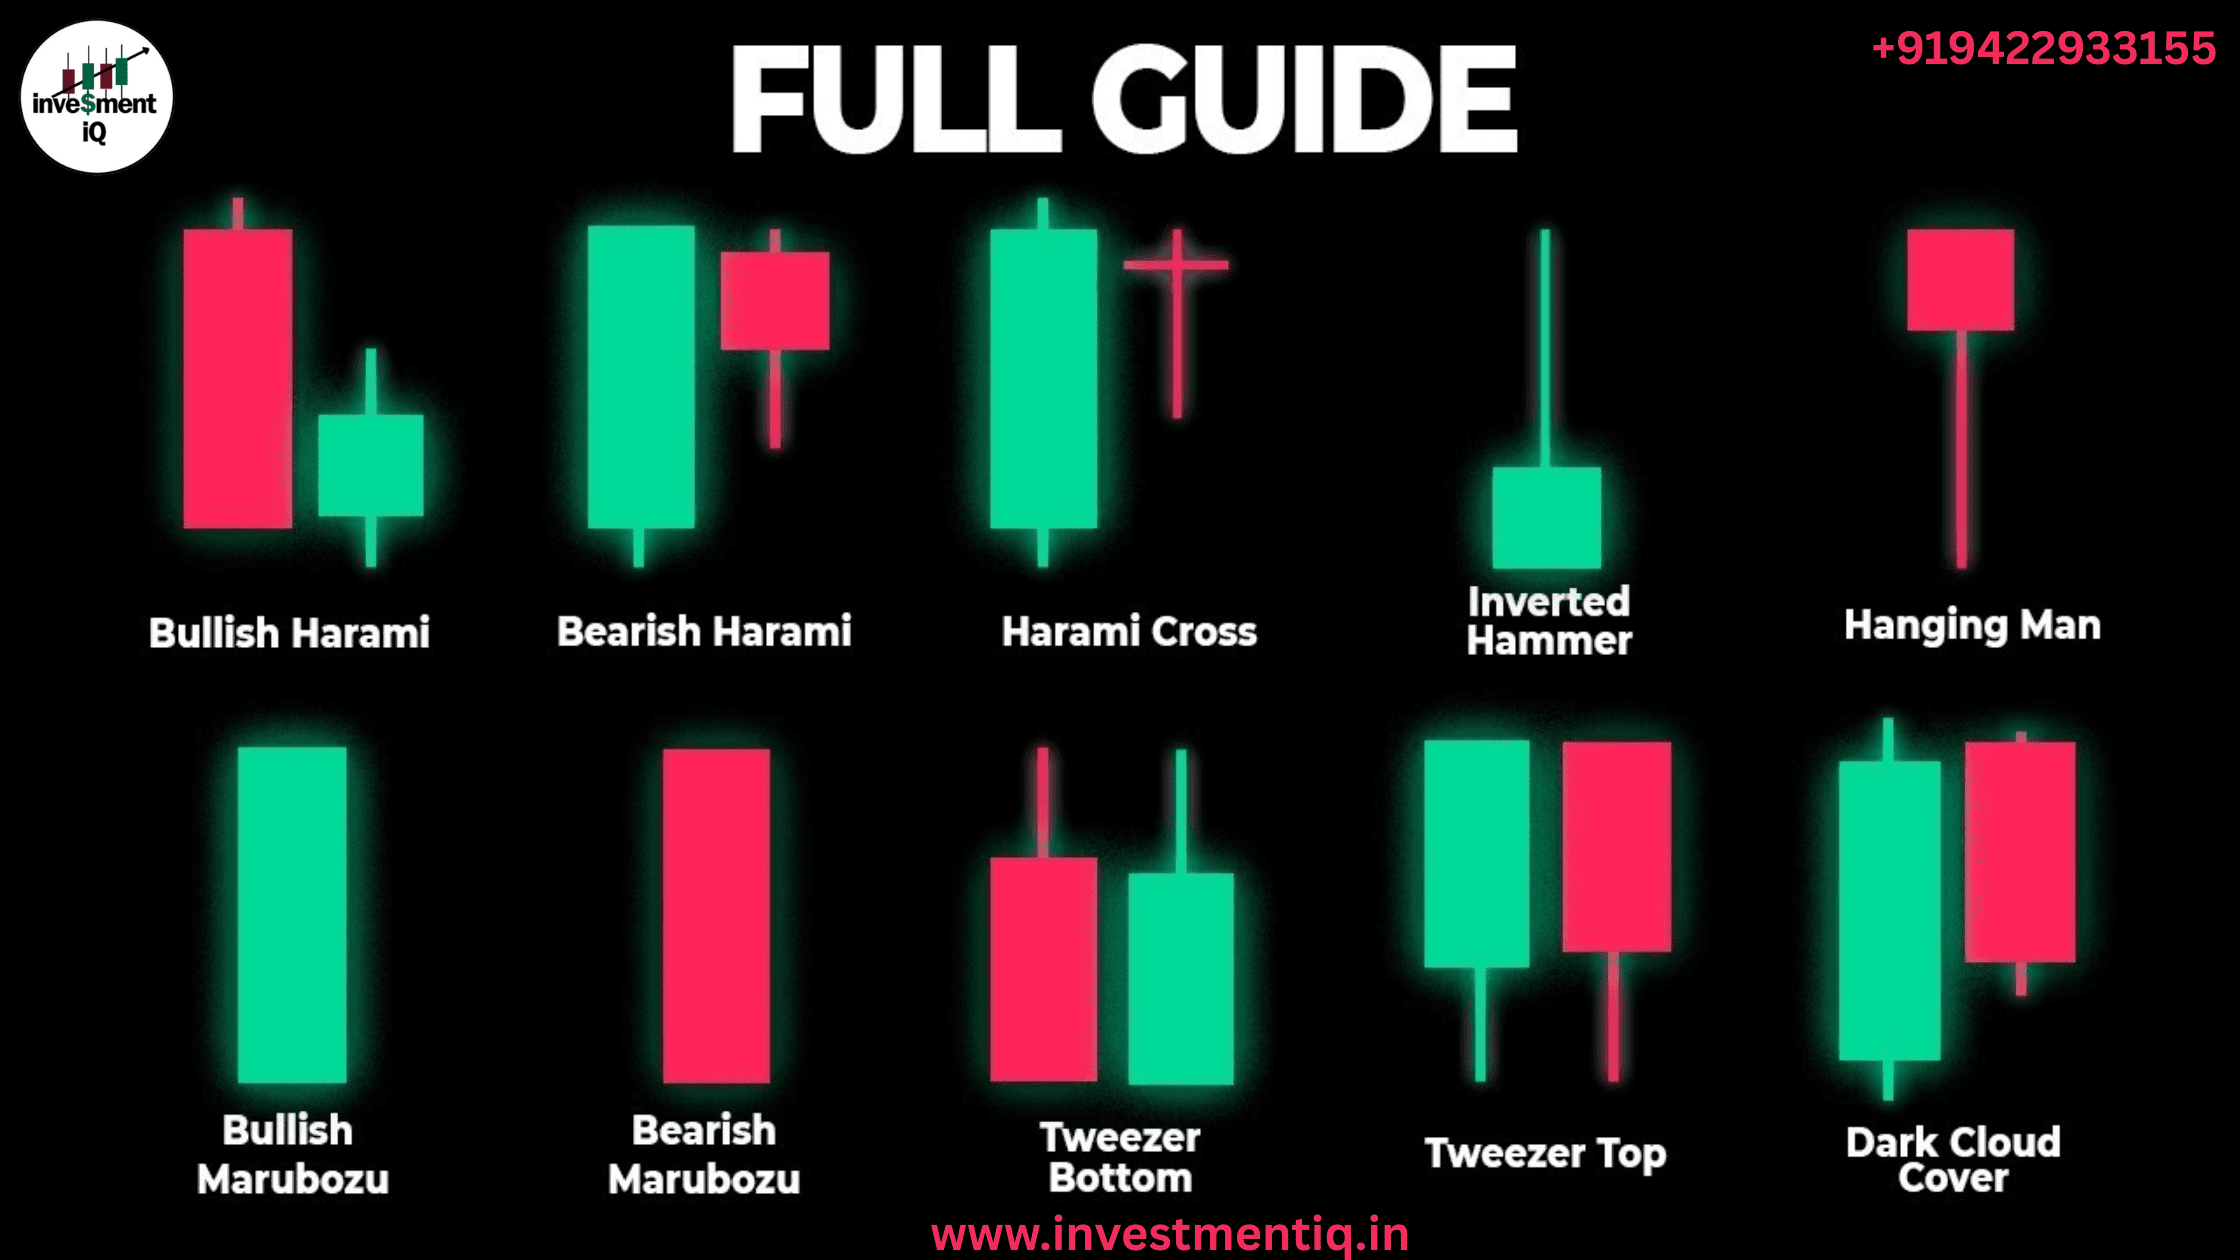
There are two types of candlestick patterns, categorized into single candlestick patterns and multiple candlestick patterns, along with their bullish or bearish implications.
Single Candlestick Patterns:
A single candlestick pattern is formed by just one candle using the open, close, high, and low prices of a single trading period
Types of Bullish Single Candlestick Patterns:
Hammer Candlestick:
hints at a possible bullish turn, particularly near the bottom of a downtrend.

Inverted Hammer Candlestick:
Similar to Hammer, indicates potential bullish reversal.

Doji Candlestick:
Represents market indecision with equal opening and closing prices

Morning Star and Evening Star:
Morning Star: A three-candle pattern that indicates when an uptrend is about to begin.
The evening star, which signals a change from an upward to a downward trend, is the opposite of the morning star.

Practical Tips for Using Candlestick Patterns
✅ Always Look for Confirmation – Never rely on a single pattern alone. Combine candlestick analysis with other indicators like volume, moving averages, and RSI.
✅ Practice on a Demo Account – Before applying real money, practice identifying candlestick patterns on a demo trading account.
Keep Up with Market Trends: Market trends can be influenced by economic news, earnings reports, and geopolitical events. Always stay informed.
✅ Use Stop-Loss Orders – Minimize risks by setting stop-loss levels to protect your investments from unexpected reversals.
you may be interested in this blog here:-
What’s the difference between Treasury bonds, notes, and bills
Can I Open a Brokerage Account for My Child
What is the Contrast Between Favored Stock and Normal Stock?


