Where Is the Stock Market in India?
Where Is the Stock Market in India? A Beginner’s Guide to Market Trends and Financial Growth Where Is the Stock Market in India? Where Is the Stock Market in India?…

Where Is the Stock Market in India? A Beginner’s Guide to Market Trends and Financial Growth Where Is the Stock Market in India? Where Is the Stock Market in India?…

Who Created the Stock Market? A Beginner's Guide to Market Trends and Financial Literacy Ever wondered who started the whole stock market thing? You're not alone—and the answer might surprise…
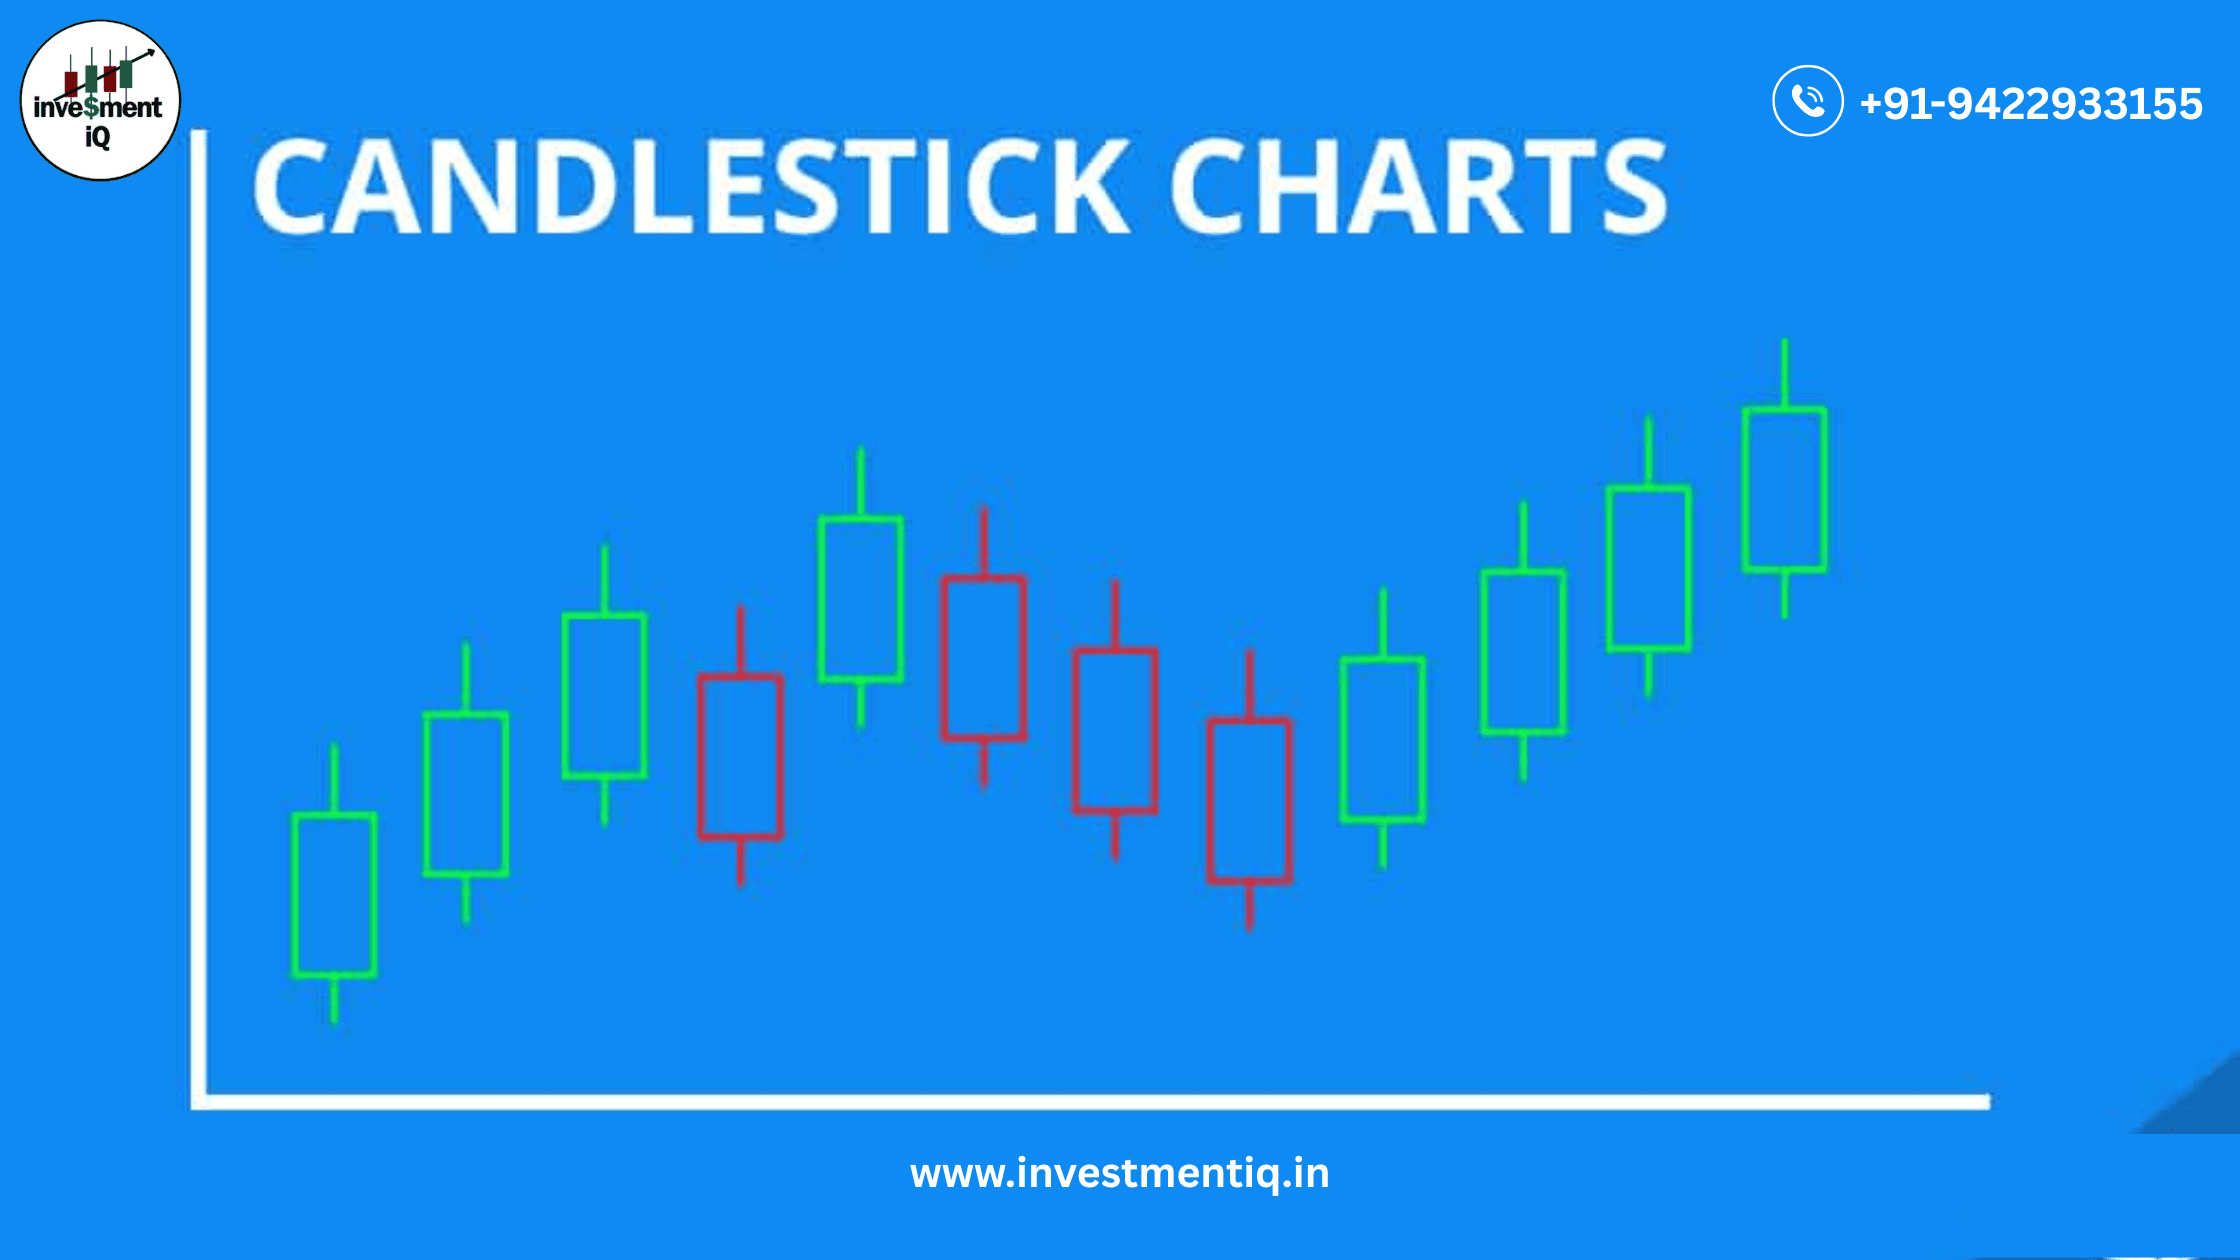
Candlesticks and Traditional Chart Analysis Benefits of Candlestick Charts Candlestick charts have merits as a charting system, Candlesticks and traditional chart analysis), but they also confirm signals generated by other…
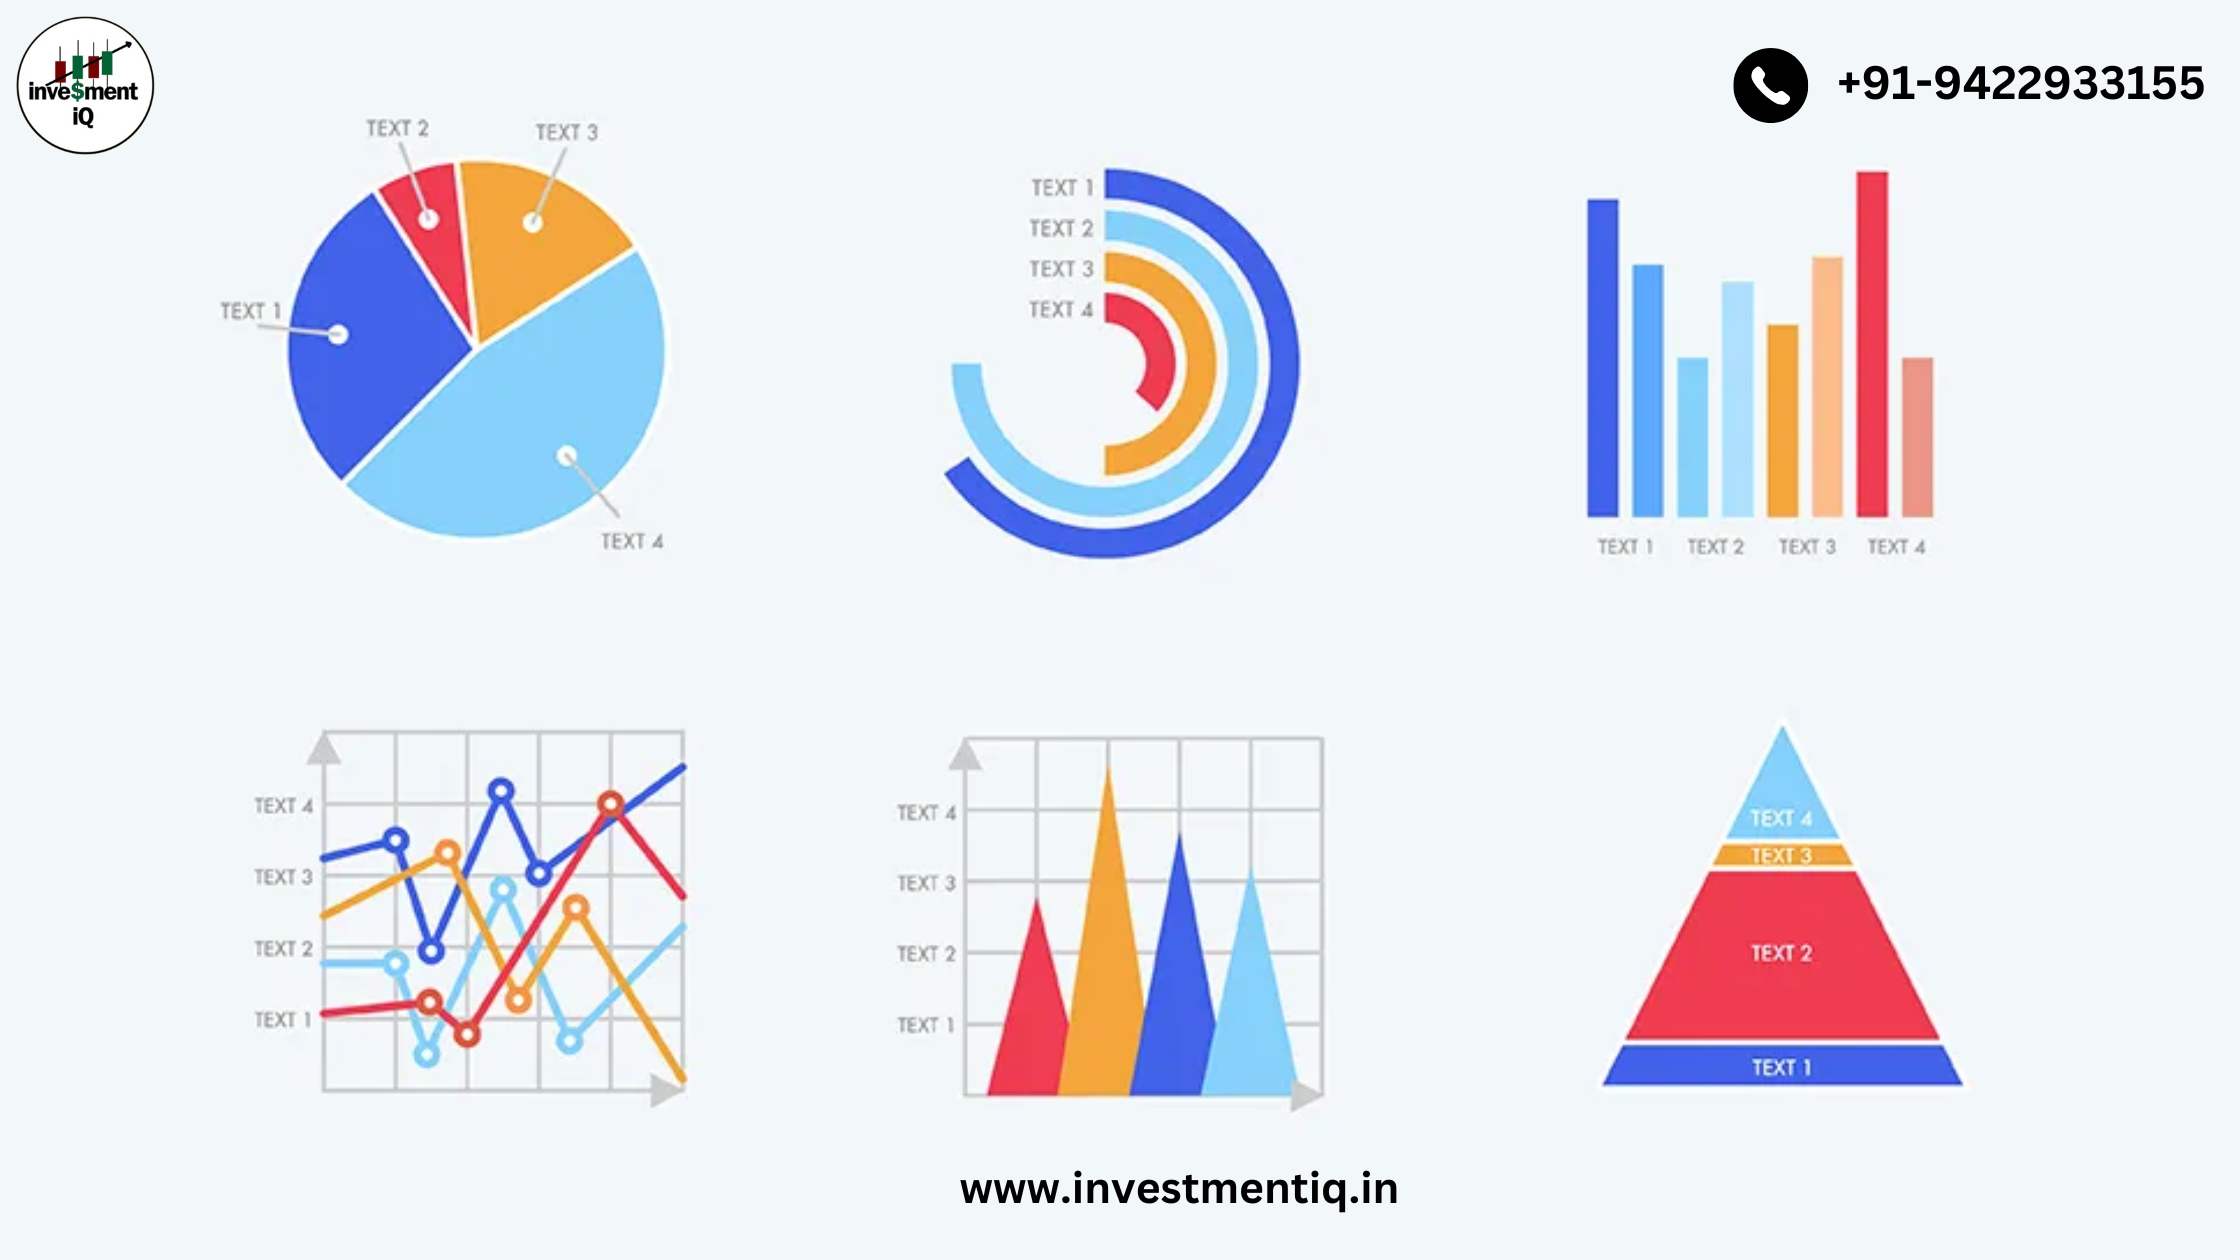
Chart Data Chart Data Charts are created from data such as price data and index data. Price Data Exchanges record the price and number of shares for each stock transaction,…

Bob Farrel's Market Rules Bob Farrell is a Bob Farrell's 10 Rules Wall Street veteran whose 10 rules are drawn on 50 years of experience crafting his investing rules. After…

The Value of Technical Analysis The reason technical analysis has value is that directional price moves are often sustained for a period of time, allowing analysts to detect and profit…
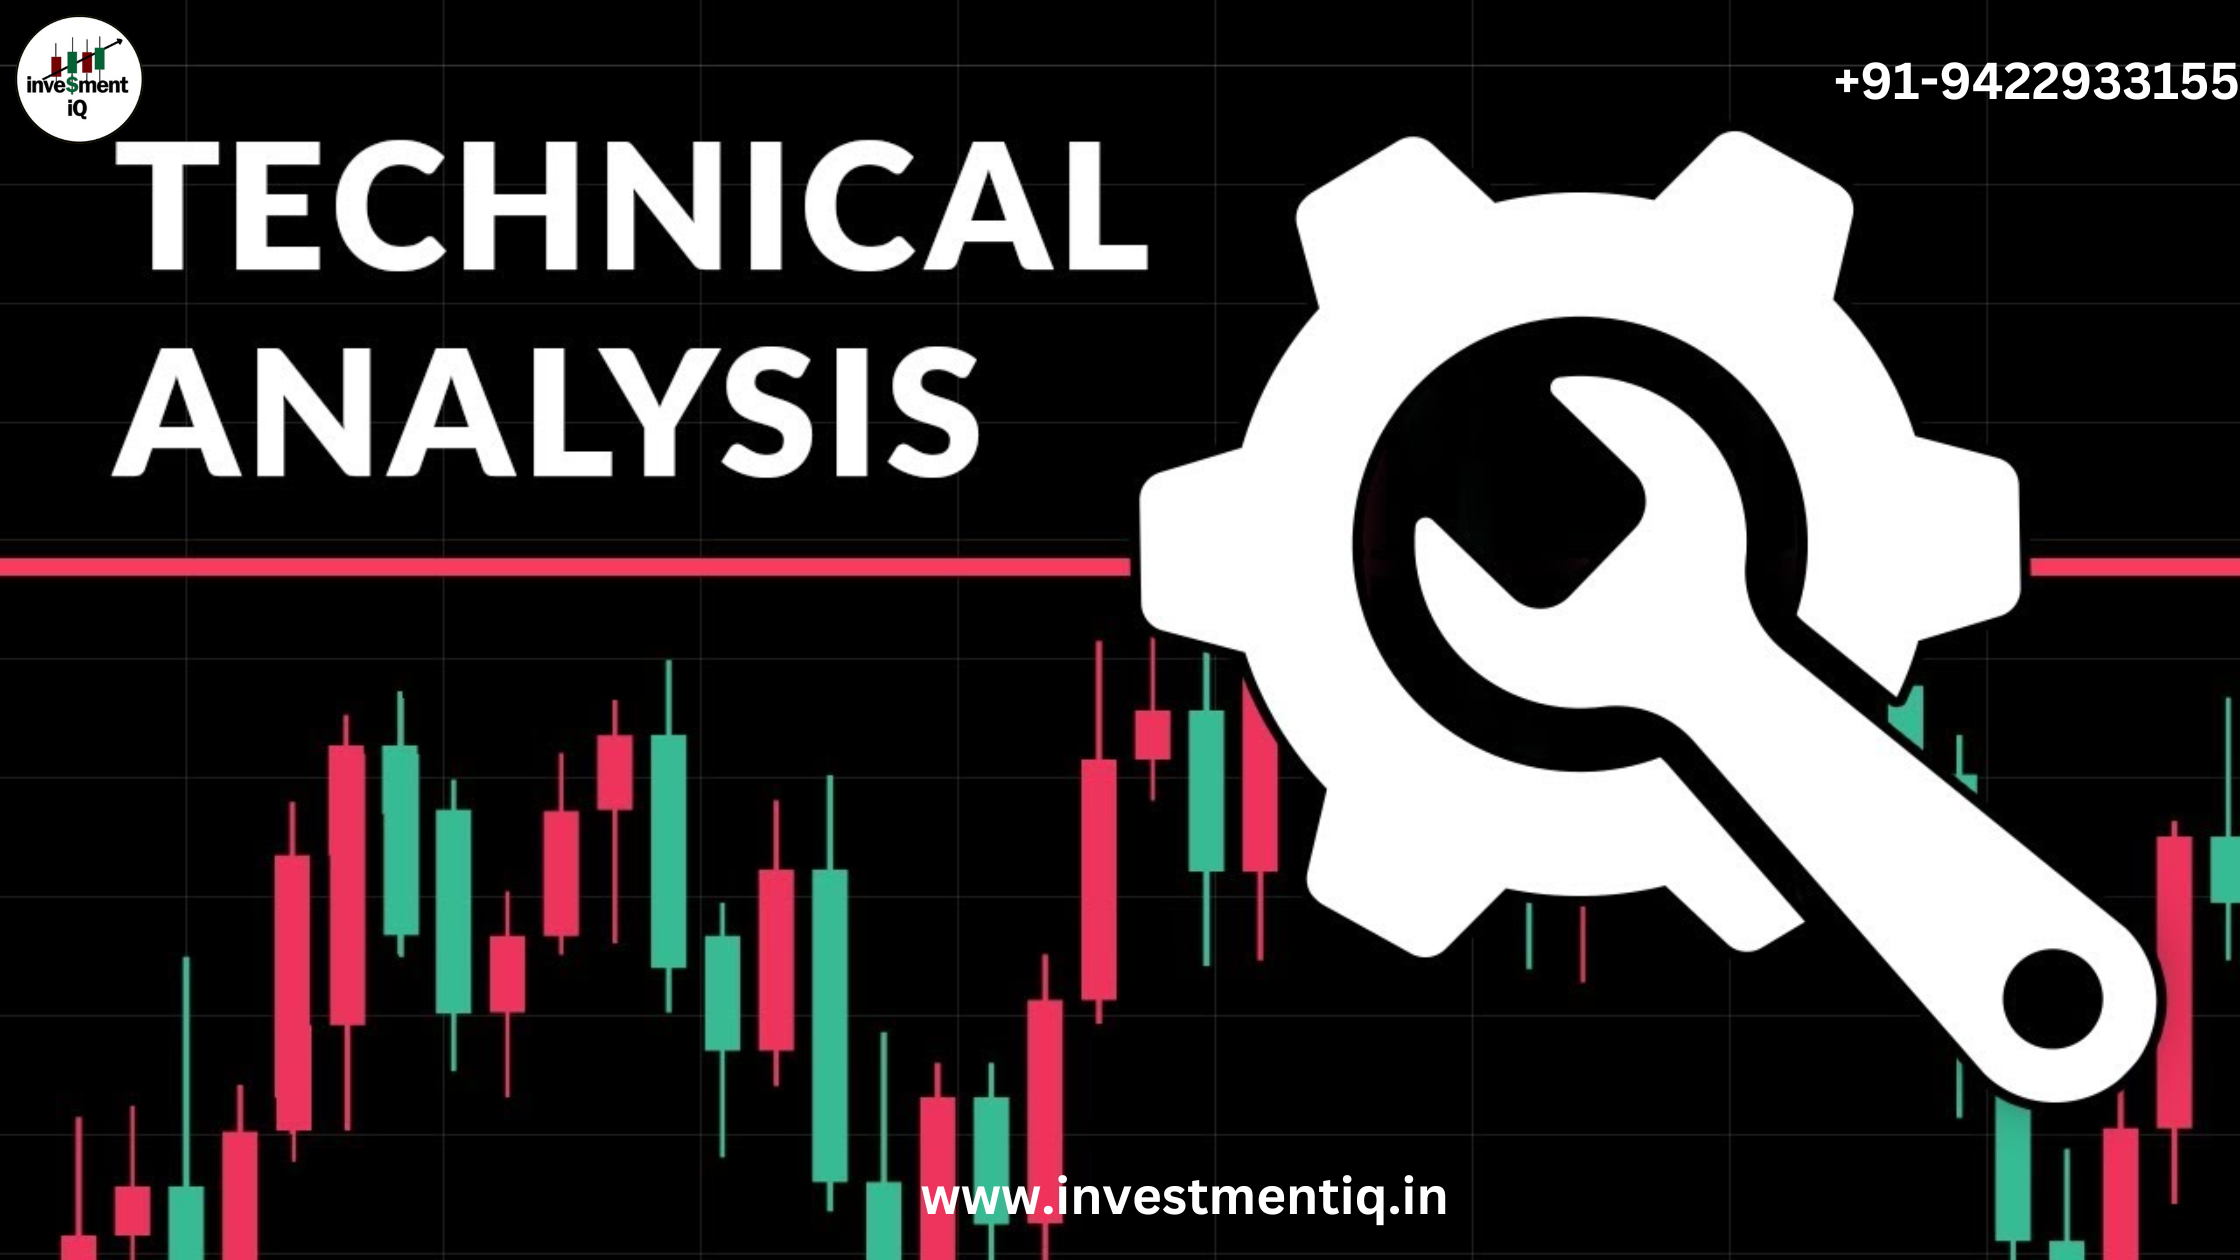
Defining Technical Analysis Defining Technical Analysis Technical analysis is the study of price and volume changes over time. Technical analysis usually involves using financial charts to help study these changes.…

Introduction Which way is the market moving? How far up or down will it go? And when will it go the other way? These are the basic concerns of the…
Why Analyze Securities? This thorough book will help you understand the stock market and why it is crucial for any investor to analyze equities. Investigate the various analysis methods and choose wisely while making investments. Security Analysis: Does it Matter? The goal of the many analysts, strategists, and portfolio managers employed by Wall Street is to outperform the market. The purpose of hiring analysts is to identify cheap stocks. To forecast the path of the market and other industries, strategists are employed. To put everything together and beat their benchmark, which is often the S&P 500 index, portfolio managers are employed. It's safe to conclude that roughly 75% of equity mutual funds underperform the S&P 500, despite the fact that there are several research and disagreements over this topic. Given these statistics, isn't it better for individual investors to just buy index funds instead of trying to outperform the market? Market analysis can be done in a variety of methods. Analysis's additional value depends on the individual: A fundamental analyst believes that analyzing strategy, management, product, financial statistics, and…
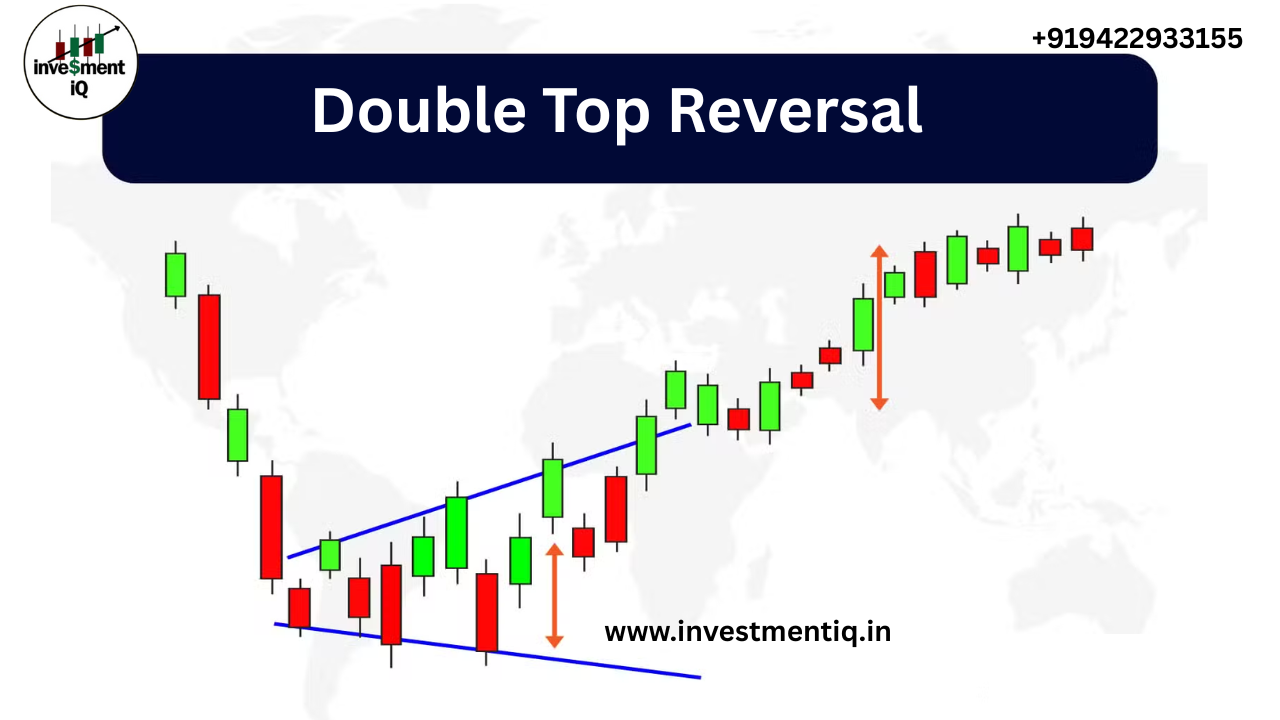
Explore the Double Top Reversal chart pattern and learn to identify, interpret, and trade this common bearish reversal pattern. A common bearish reversal pattern on bar, line, and candlestick charts is the Double Top Reversal.As the name suggests, the pattern consists of two about equal peaks that are followed by a mild dip. The traditional Double Top Reversal pattern indicates at least an intermediate-term shift from bullish to bearish, though there may be variances. An illustration of a Double Top Reversal can be seen in the chart below. Example of a classic Double Top Reversal…