
Why Are Chart Patterns Important?
The forces of supply and demand drive prices in the financial market. Who is winning—the sellers or the buyers? In order to determine whether a market is heading upward, downward, or sideways, chart patterns offer a visual depiction of the conflict between buyers and sellers. You can make better buying and selling judgments if you are aware of this.
Numerous chart designs are available. The majority fall into one of two general categories: continuation patterns or reversal patterns. While continuation patterns suggest the price trend will continue following a brief consolidation, reversal patterns indicate a change in the trend.
Chart Patterns for Trading
A collection of typical chart patterns that are helpful in technical analysis is shown below. You might find Introduction to Chart Patterns useful if you want further information on how to use chart patterns when examining a chart. It should be noted that the chart patterns have been categorized according to whether they are usually continuation or reversal patterns. Keep in mind that, depending on the situation, many of these patterns may suggest a continuance or a reversal.
You can explore the chart patterns in the list below and learn how to use them in trading.
Reversal Patterns
- Broadening Top
- Double Top Reversal
- Double Bottom Reversal
- Head and Shoulders Top
- Head and Shoulders Bottom
- Falling Wedge
- Rising Wedge
- Rounding Bottom
- Triple Top Reversal
- Triple Bottom Reversal
- Bump and Run Reversal
Continuation Patterns
- Flag, Pennant
- Symmetrical Triangle
- Ascending Triangle
- Descending Triangle
- Rectangle
- Price Channel
- Measured Move – Bullish
- Measured Move – Bearish
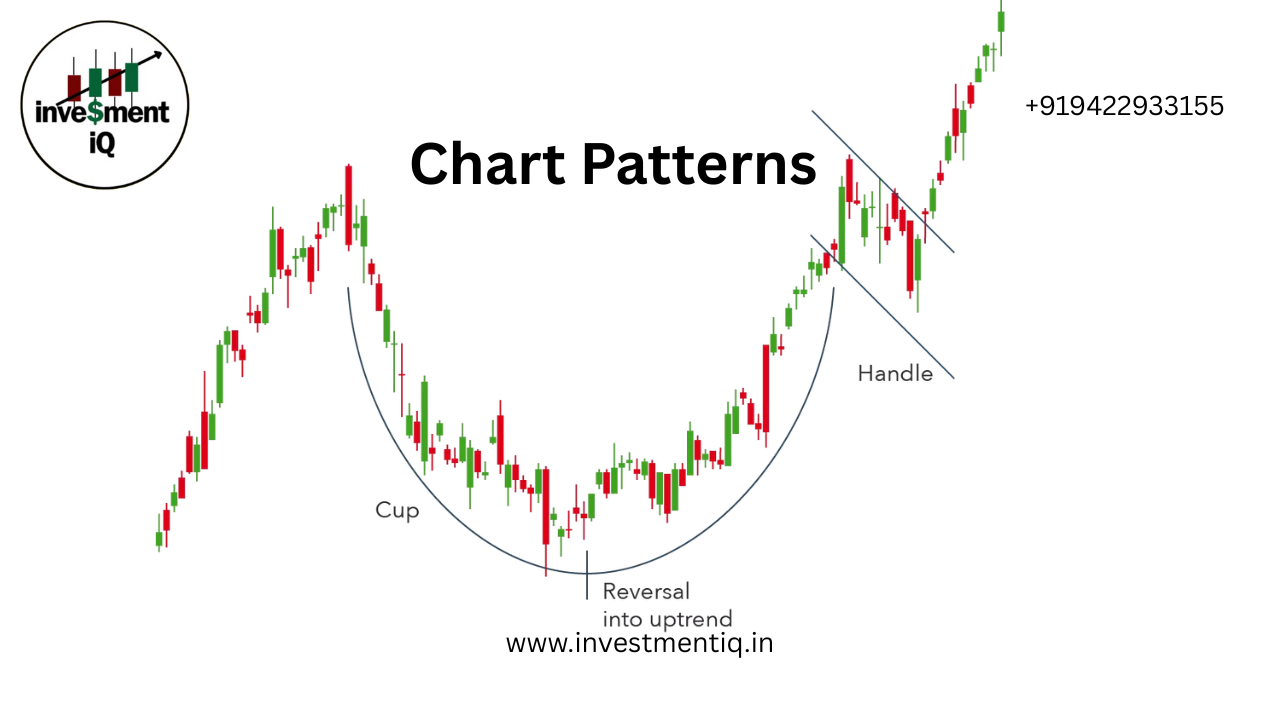
- Cup with Handle
Chart Pattern Limitations
Chart patterns have limitations, even while they can be used to determine if a stock is going higher or lower, whether buyers or sellers are in control, and whether now is a suitable moment to enter a trade. A chart pattern may occasionally fall short of your expectations. At other occasions, you might need to wait patiently for a particular pattern to emerge. Patterns on charts are arbitrary and susceptible to interpretation. You must watch charts with longer timeframes in order to practice observing chart patterns because of these limitations.
Has a comparable trend previously emerged? If yes, what was the response of supply and demand? How frequently did the price hit its predetermined level? How frequently did it not work?
you may be interested in this blog here:

