
Introduction
Imagine you’re solving a complex puzzle, with each piece revealing a part of the bigger picture. Technical analysis with candlestick patterns is like that puzzle, offering insights into market trends and potential movements. This guide will help you master the art of technical analysis using candlestick patterns, enhancing your trading strategy.
What is Technical Analysis?
Technical analysis involves analyzing past price movements and trading volumes to forecast future market behavior. Candlestick patterns are a crucial element of this analysis, providing visual cues about market sentiment.
Key Candlestick Patterns
Visualizing the Patterns: Think of candlestick patterns as different shapes in a puzzle. Each pattern provides a unique clue about the market’s direction. Here are some essential patterns:
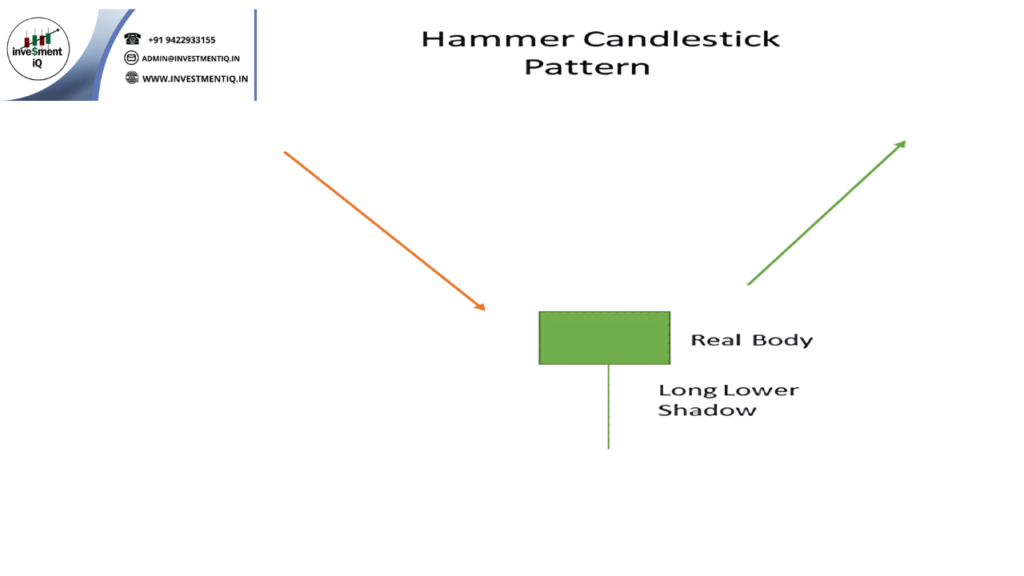
- Hammer: A bullish reversal pattern with a small body and long lower shadow, indicating potential upward movement.
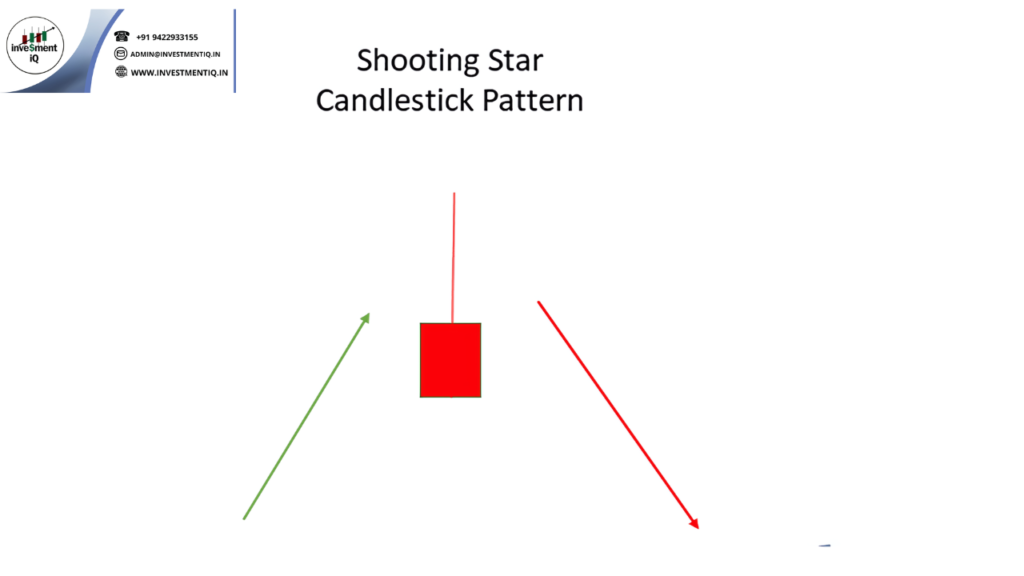
- Shooting Star: A bearish reversal pattern with a small body and long upper shadow, suggesting a potential downtrend.
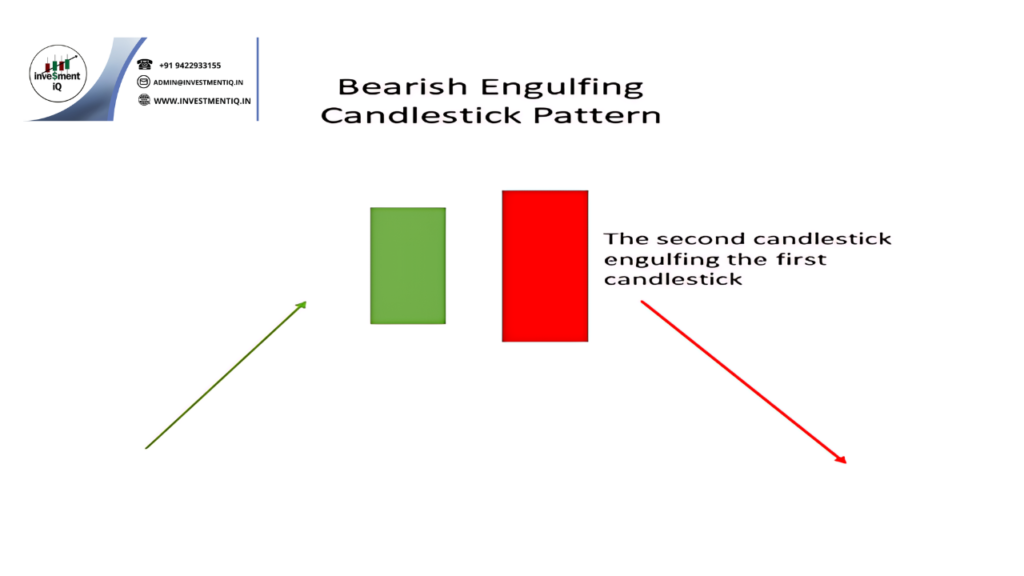
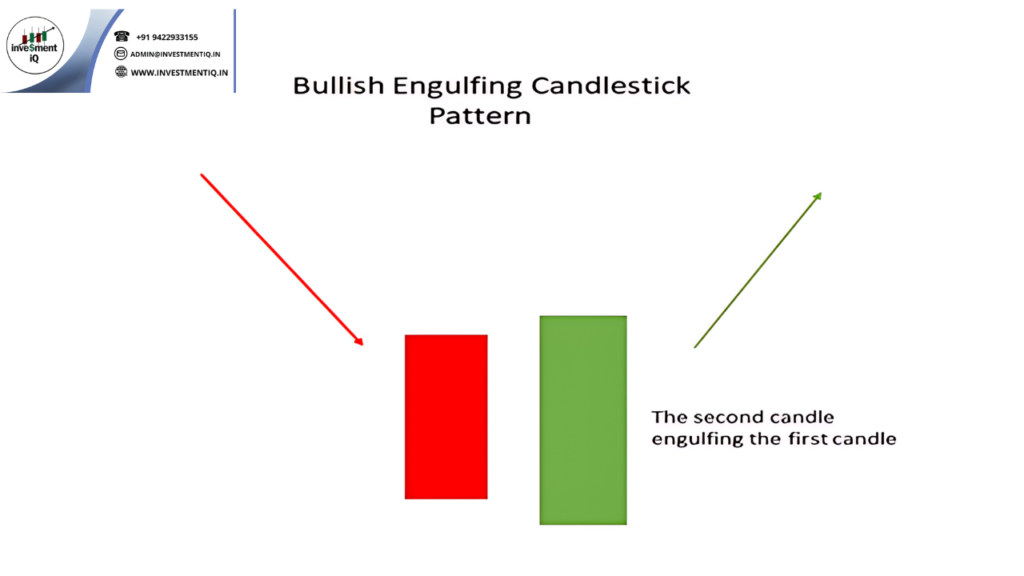
- Engulfing Pattern: A reversal pattern where a larger candle engulfs the previous smaller candle, indicating a strong market shift.
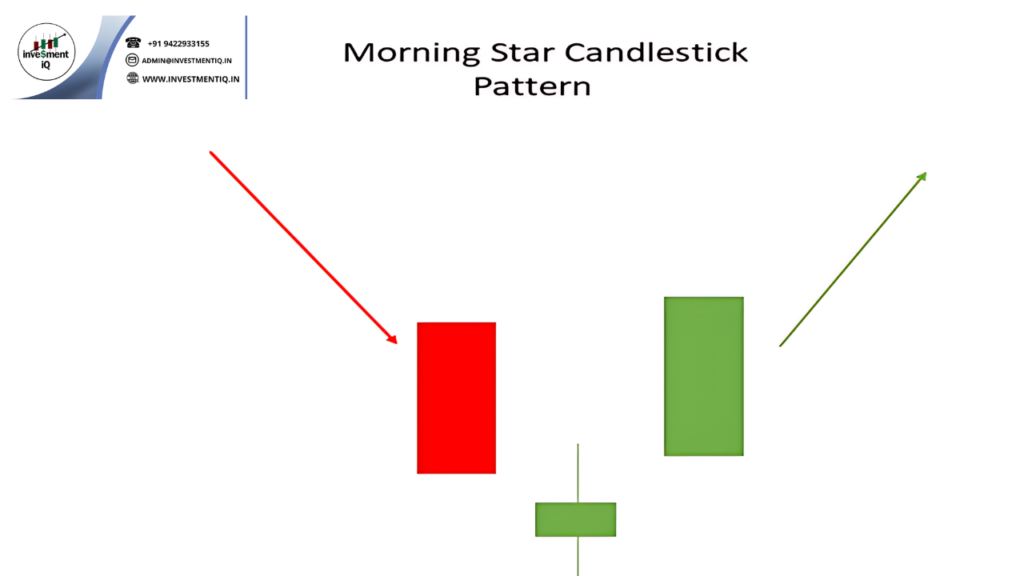
- Morning Star: A three-candle bullish reversal pattern indicating the end of a downtrend.
Applying Technical Analysis with Candlestick Patterns
Step-by-Step Approach:
- Identify the Pattern: Look for specific candlestick patterns on the chart.
- Confirm with Indicators: Use technical indicators like moving averages, RSI, or Bollinger Bands to confirm the pattern’s signal.
- Analyze Volume: Higher volume on the pattern day strengthens its reliability.
- Set Entry and Exit Points: Enter a trade based on the pattern’s direction and set stop-loss levels to manage risk.
Example Scenario: Imagine you spot a Hammer pattern after a downtrend. The next day, the stock opens higher and is supported by increasing volume. You use additional indicators to confirm the bullish signal and decide to enter a long position, anticipating further gains.
Conclusion
Technical analysis with candlestick patterns is a powerful tool for traders. By mastering these patterns and integrating them into your analysis, you can make more informed trading decisions and navigate the market with greater confidence.
you may be interested in this blog here:-
Full Stack Development Salary in India – 2024 Trends and Insights
Salesforce Developer Salary in India An In-Depth Analysis
Ultimate Guide to UKG Math Worksheet PDF Free Download
Advanced OOP Concepts in SAP ABAP A Comprehensive Guide


