
Introduction
The Doji pattern is a crucial candlestick formation that indicates market indecision. It can signal potential reversals or continuation patterns and provides valuable insights into market sentiment. This article will decode the Doji pattern and explain how traders can use it effectively.
Understanding the Doji Pattern
The Doji candlestick features a small body with long wicks on either side, indicating that the opening and closing prices are nearly identical. This pattern signifies indecision and a balance between buying and selling pressure.
Types of Doji Patterns:
1. Standard Doji A Standard Doji has a small body with equal-length wicks on both sides. It indicates that the market is at a stalemate and may signal a reversal or continuation, depending on the context.
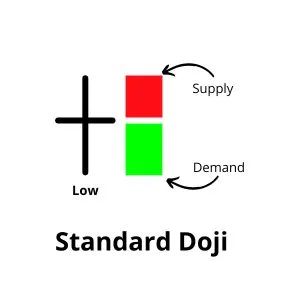
- Confirmation: Look for additional confirmation from subsequent candlesticks or technical indicators.
2. Gravestone Doji The Gravestone Doji has a small body at the bottom with a long upper wick, suggesting that buyers initially pushed prices higher but ultimately failed to maintain the gains. It indicates a potential bearish reversal.
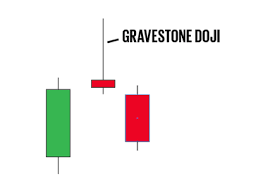
- Confirmation: Verify with additional bearish confirmation and check for increased volume.
3. Dragonfly Doji The Dragonfly Doji has a small body at the top with a long lower wick, indicating that sellers initially drove prices lower but ultimately lost control. It suggests a potential bullish reversal.
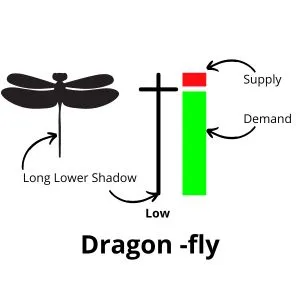
- Confirmation: Look for follow-through with bullish candlesticks and verify with other indicators.
Using Doji Patterns in Trading
Combining Doji with Other Indicators: To enhance the reliability of the Doji pattern, combine it with other technical indicators such as Moving Averages, RSI, or MACD. This multi-faceted approach provides additional confirmation and helps validate the pattern.
Identifying Market Context: Consider the market context and trend when interpreting the Doji pattern. For example, a Doji appearing after a strong uptrend may indicate a potential reversal, while a Doji in a consolidation phase might suggest a continuation.
Setting Entry and Exit Points: Set entry points based on confirmation from subsequent candlesticks or indicators. For example, after spotting a Dragonfly Doji, consider entering a trade when the next candlestick confirms the bullish signal.
Risk Management: Implement stop-loss orders to manage risk and protect against unexpected market movements. Adjust your position size based on your risk tolerance and the trade setup.
Conclusion
Decoding the Doji pattern can provide valuable insights into market sentiment and potential price movements. By understanding and utilizing the Doji pattern effectively, traders can enhance their trading strategies and improve their decision-making process.
you may be interested in this blog here:-
Full Stack Development Salary in India – 2024 Trends and Insights
Salesforce Developer Salary in India An In-Depth Analysis

