
Introduction
The Hammer and Hanging Man are significant candlestick patterns used to analyze market trends and predict potential reversals. Recognizing these patterns can help traders make more informed decisions. In this article, we’ll explore the Hammer and Hanging Man patterns and discuss how to use them effectively.
What Are Hammer and Hanging Man Patterns?
Hammer Pattern:
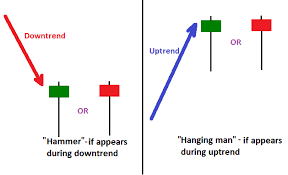
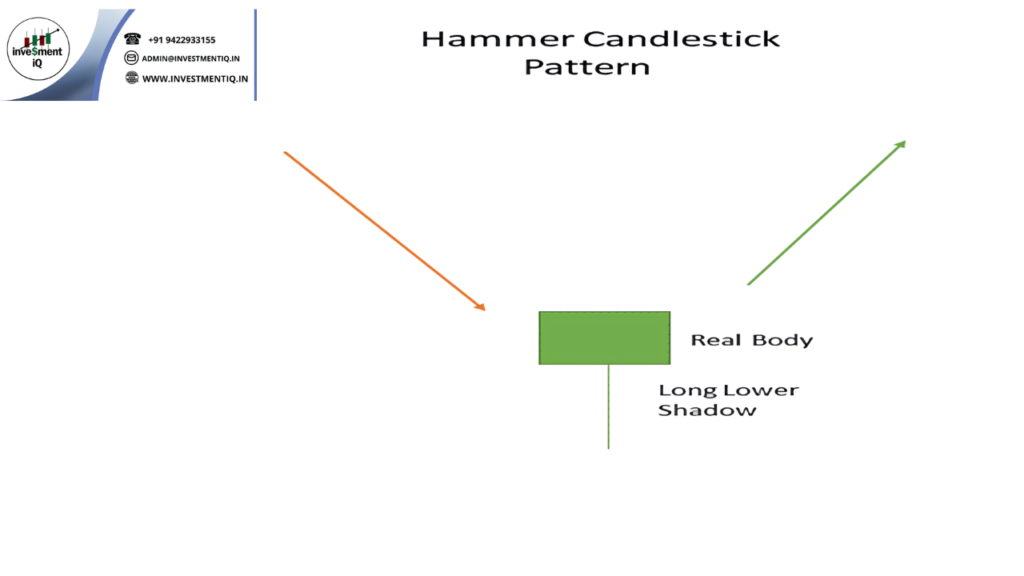
- Appearance: The Hammer has a small body at the top with a long lower wick. It appears after a downtrend and suggests a potential bullish reversal.
- Characteristics: The lower wick should be at least twice the length of the body, indicating strong buying pressure.
Hanging Man Pattern:
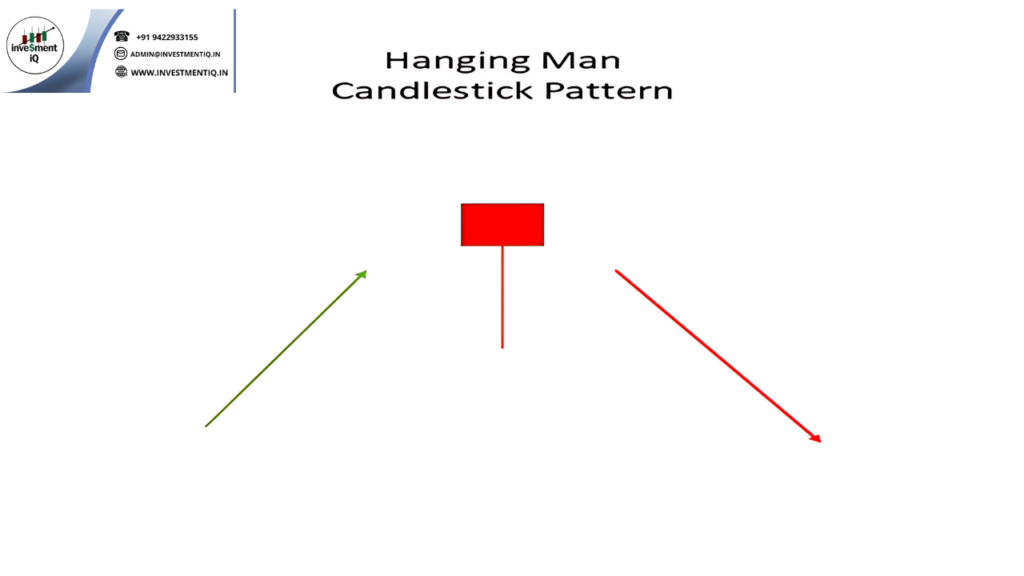
- Appearance: The Hanging Man has a similar shape to the Hammer but appears after an uptrend, signaling a potential bearish reversal.
- Characteristics: The lower wick should be at least twice the length of the body, indicating that sellers may be gaining control.
How to Identify and Interpret Hammer and Hanging Man
Hammer Pattern:
- Identification: Look for a small-bodied candlestick with a long lower wick following a downtrend. The pattern suggests that buyers may be starting to take control.
- Interpretation: Confirm the reversal with subsequent bullish candlesticks or technical indicators. A strong follow-through can validate the reversal signal.
Hanging Man Pattern:
- Identification: Look for a small-bodied candlestick with a long lower wick following an uptrend. The pattern indicates that sellers may be starting to gain control.
- Interpretation: Confirm the reversal with subsequent bearish candlesticks or additional indicators. A strong follow-through can validate the bearish signal.
Trading Strategies with Hammer and Hanging Man Patterns
Setting Entry Points:
- Bullish Entry (Hammer): Enter a trade when the price moves above the high of the Hammer candlestick, confirming the reversal.
- Bearish Entry (Hanging Man): Enter a trade when the price moves below the low of the Hanging Man candlestick, confirming the reversal.
Setting Exit Points:
- Profit Targets: Set profit targets based on recent highs or lows, depending on the direction of the trade.
- Stop-Loss Orders: Implement stop-loss orders just below the low of the Hammer or above the high of the Hanging Man to manage risk.
Risk Management:
- Position Sizing: Adjust your position size based on risk tolerance and the distance between entry and stop-loss levels.
- Diversification: Combine Hammer and Hanging Man patterns with other technical analysis tools to enhance your trading strategy.
Conclusion
The Hammer and Hanging Man patterns are valuable tools for analyzing market trends and predicting potential reversals. By understanding how to recognize and interpret these patterns, and by incorporating them into a well-rounded trading strategy, you can improve your trading decisions and enhance your overall performance.
you may be interested in this blog here:-
Full Stack Development Salary in India – 2024 Trends and Insights
Salesforce Developer Salary in India An In-Depth Analysis

