
Introduction
The Harami Patterns is a versatile candlestick formation that traders can use to spot potential reversals. In this article, we’ll dive into the Harami pattern, explaining how it forms and how traders can use it in their strategies.
Understanding the Harami Patterns
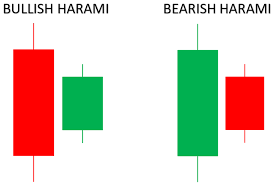
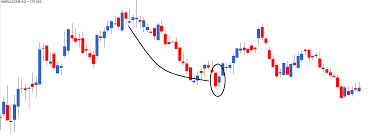
The Harami pattern consists of two candlesticks: a large candle followed by a smaller one that is completely contained within the previous candle’s body. The pattern signals indecision in the market and can indicate a reversal.
Types of Harami Patterns
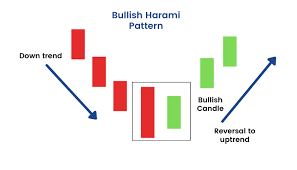
- Bullish Harami: Forms in a downtrend, with a small bullish candle following a large bearish one.
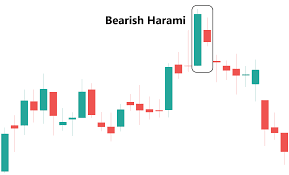
- Bearish Harami: Forms in an uptrend, with a small bearish candle following a large bullish one.
Why the Harami Patterns is Important
The Harami pattern is significant because it highlights a potential shift in market sentiment, making it a valuable tool for predicting reversals.
How to Identify the Harami Pattern
Look for a large candle followed by a smaller candle that is completely engulfed by the body of the previous candle. The pattern is more reliable when it appears after a strong trend.
Using the Harami Pattern in Trading
Traders can use the Harami patterns to anticipate reversals and adjust their positions accordingly. For example, a Bullish Harami could signal an opportunity to enter a long position, while a Bearish Harami might suggest it’s time to sell.
Real-World Examples Example: A Bearish Harami pattern formed at the peak of a financial stock, signaling the end of an uptrend. Traders who recognized this pattern were able to avoid losses by exiting their positions early.
Psychological Aspect The Harami patterns reflects market indecision, with the smaller candle showing that momentum is waning, potentially leading to a reversal.
Limitations The Harami patterns can produce false signals, particularly in choppy markets. It’s essential to confirm the pattern with other indicators like moving averages or volume.
Conclusion The Harami pattern is a useful tool for traders looking to anticipate market reversals. By understanding and applying this pattern, traders can make more informed decisions and improve their trading outcomes.
you may be interested in this blog here:-
Full Stack Development Salary in India – 2024 Trends and Insights
Salesforce Developer Salary in India An In-Depth Analysis

