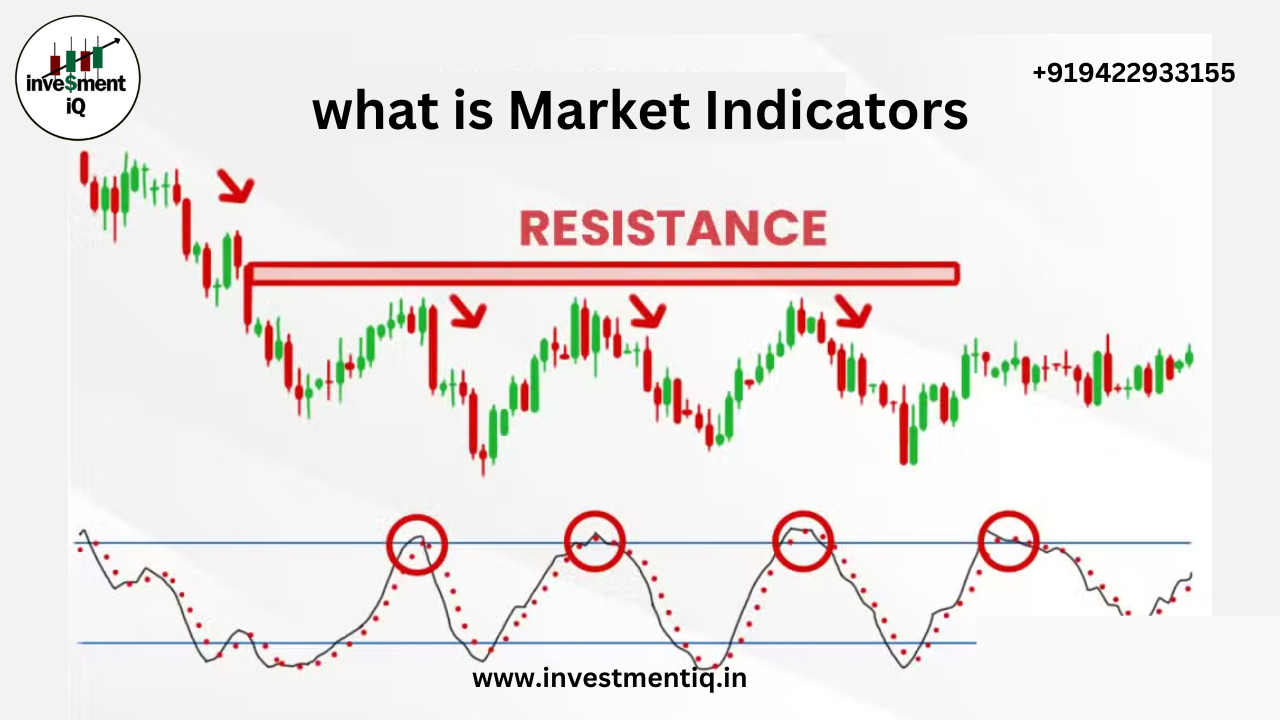
Introduction to Market Indicators
Market Indicators are used to measure the health of a group of related stocks, usually by measuring group participation in a trend. The group can be the members of a broad index, a specific sector, or even an entire market.
Market Indicators vs. Technical Indicators
Entering this data into the indicator algorithm yields the desired data point.Market indicators are not plotted above or below the chart, in contrast to technical indicators. Since they are being charted, market indicators have their own ticker symbols. The $BPSPX and $BPNDX, for instance, monitor the Bullish Percent Index for the S&P 500 and the NASDAQ 100, respectively. This is an example of one of the numerous symbols that apply the same market indicator formula to several markets.
Market Breadth Indicators
The number or percentage of stocks in the group that are following a trend is measured by breadth indicators. The price data of the group’s stocks is usually the basis for market breadth indicators. For instance, the number of stocks in the group that saw price increases (referred to as “advancers”) vs those who saw price decreases (referred to as “decliners”) is used to compute the Advance-Decline Line. The difference between the proportion of equities that make new 52-week highs and those that make new 52-week lows is measured by the Net New 52-Week Highs indicator.
you may be interested in this blog here:


