
Introduction
The Market Reversals with Hanging Man candlestick pattern is a crucial tool in technical analysis, particularly for identifying potential market reversals. This pattern can signal a shift in market sentiment from bullish to bearish. In this article, we’ll delve into the Hanging Man pattern, its characteristics, and how to use it effectively in your trading strategy. .
Understanding the Hanging Man Pattern
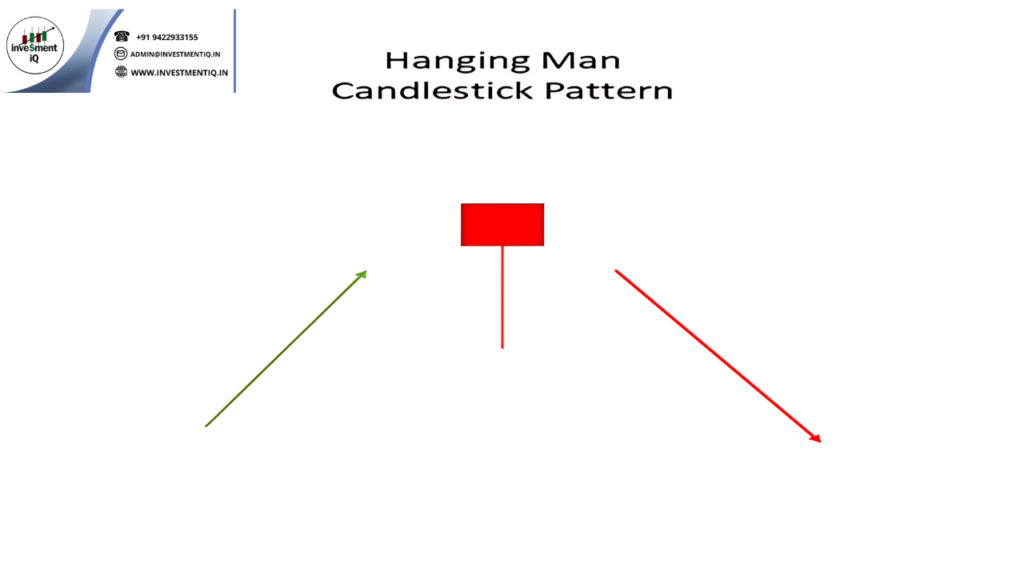
The Hanging Man is a single-candlestick pattern that appears after a strong uptrend. It has the following features:
- Appearance: A small body at the upper end of the trading range with a long lower wick. The upper wick is minimal or nonexistent.
- Significance: The pattern indicates that while buyers have managed to push the price higher, sellers have begun to exert pressure, potentially signaling a bearish reversal.
Key Characteristics:
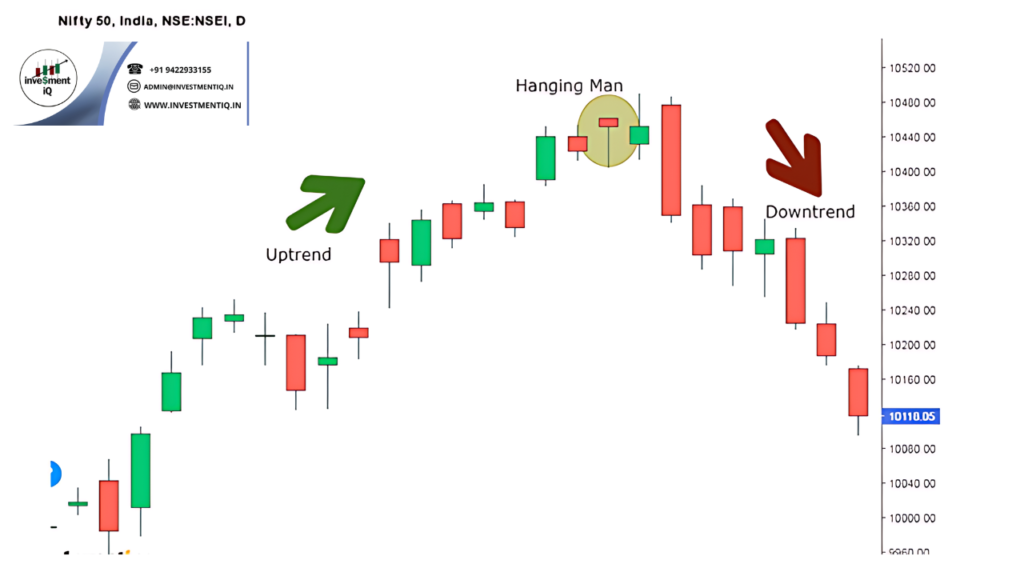
- Location: The pattern appears after an uptrend, suggesting that the trend may be losing momentum.
- Confirmation: The Hanging Man pattern is more reliable when followed by a bearish candlestick that confirms the potential reversal.
How to Identify and Interpret the Hanging Man
Identification:
- Check the Body: The body of the Hanging Man should be small and located at the top of the trading range.
- Examine the Wick: The lower wick should be at least twice the length of the body, indicating that sellers have pushed prices down significantly before the close.
Interpretation Market Reversals with Hanging Man:
- Bearish Reversal Signal: A Hanging Man indicates a potential reversal if confirmed by subsequent bearish candlesticks or technical indicators.
- Volume Analysis: Increased volume on the bearish confirmation candlestick can further validate the reversal signal.
Trading Strategies with the Market Reversals with Hanging Man
Setting Entry Points:
- Bearish Entry: Enter a trade when the price falls below the low of the Hanging Man candlestick, confirming the reversal.
- Confirmation: Ensure that the bearish candlestick following the Hanging Man confirms the signal.
Setting Exit Points:Market Reversals with Hanging Man
- Profit Targets: Set profit targets based on recent support levels or historical lows.
- Stop-Loss Orders: Implement stop-loss orders above the high of the Hanging Man pattern to manage risk.
Risk Management:
- Position Sizing: Adjust your position size based on your risk tolerance and the distance between entry and stop-loss levels.
- Diversification: Combine the Hanging Man pattern with other technical indicators and analysis techniques for a more robust strategy.
Conclusion
The Hanging Man candlestick pattern is a valuable tool for identifying potential bearish reversals after an uptrend. By understanding how to recognize and interpret this pattern, and by integrating it into a well-rounded trading strategy, you can make more informed trading decisions and enhance your overall performance.
you may be interested in this blog here:-
Full Stack Development Salary in India – 2024 Trends and Insights
Salesforce Developer Salary in India An In-Depth Analysis
Ultimate Guide to UKG Math Worksheet PDF Free Download
Advanced OOP Concepts in SAP ABAP A Comprehensive Guide
