
Introduction
Imagine you’re an artist, learning to interpret the brushstrokes of a master painter. Mastering the Candlestick Chart is akin to understanding those brushstrokes, revealing the market’s underlying story. This guide will help you master candlestick charts, enhancing your trading insights and decisions.
What is a Candlestick Chart?
A candlestick chart is a type of financial chart used to represent price movements. Each candlestick provides a visual representation of the open, high, low, and close prices for a specific time period.
Key Components of a Candlestick Chart
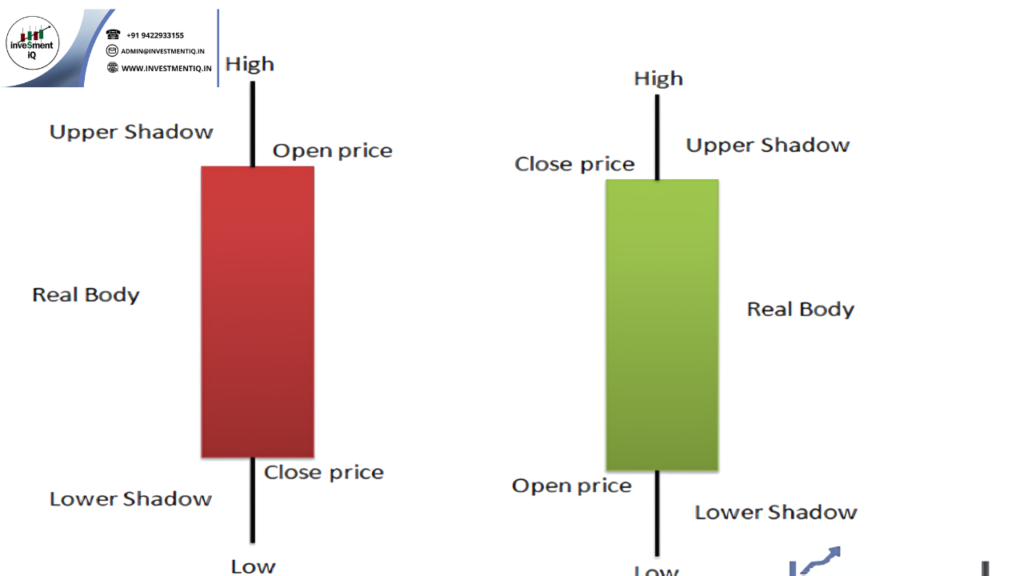
Visualizing the Candlestick: Think of each candlestick as a story with four key elements:
- Body: The rectangular part indicating the open and close prices.
- Wicks/Shadows: The lines extending from the body showing the high and low prices.
- Color: Typically, a green or white body indicates a price increase, while a red or black body indicates a price decrease.
Types of Candlestick Chart Patterns
Common Patterns:
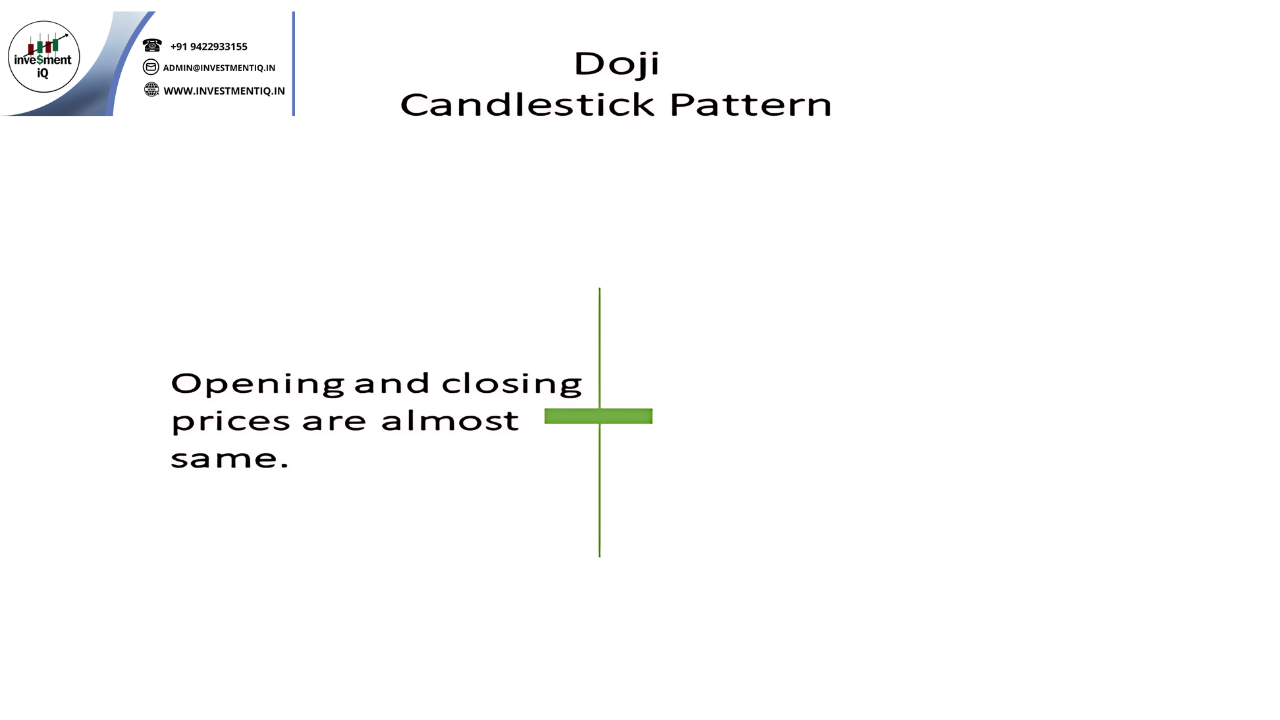
- Doji: A pattern with almost equal open and close prices, indicating indecision.
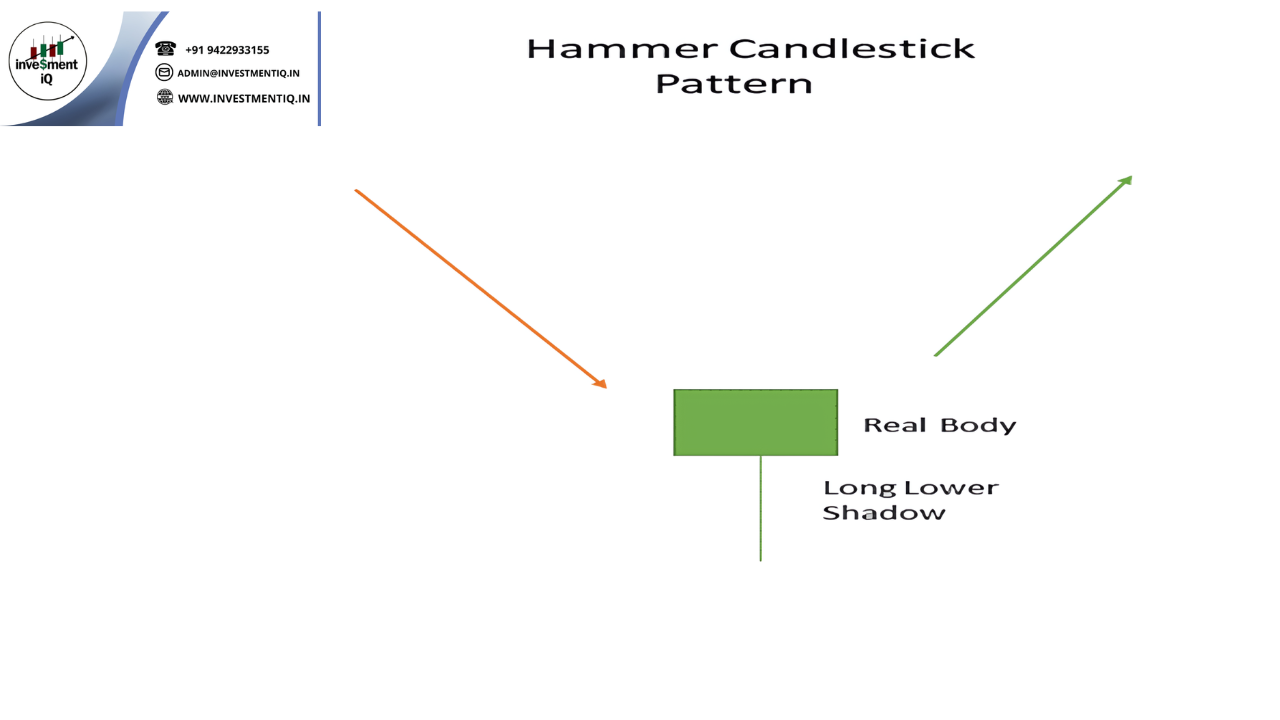
- Hammer: A bullish reversal pattern with a long lower shadow and small body.
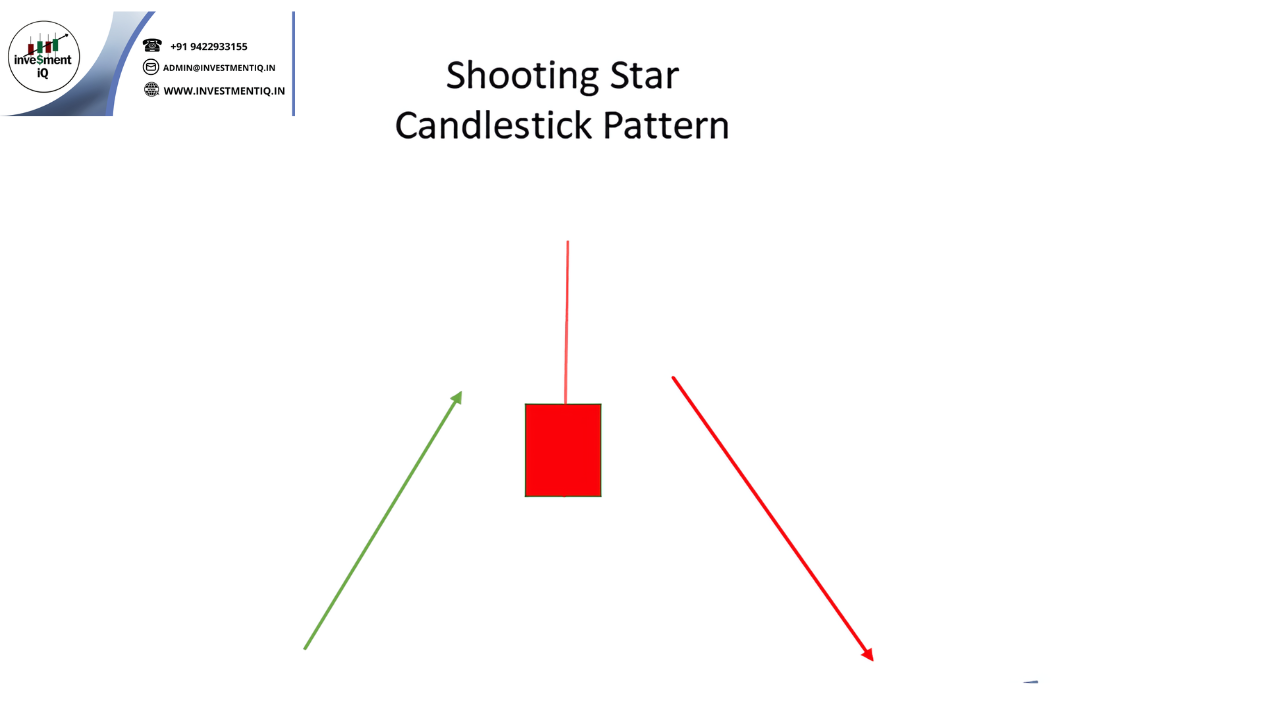
- Shooting Star: A bearish reversal pattern with a long upper shadow and small body.
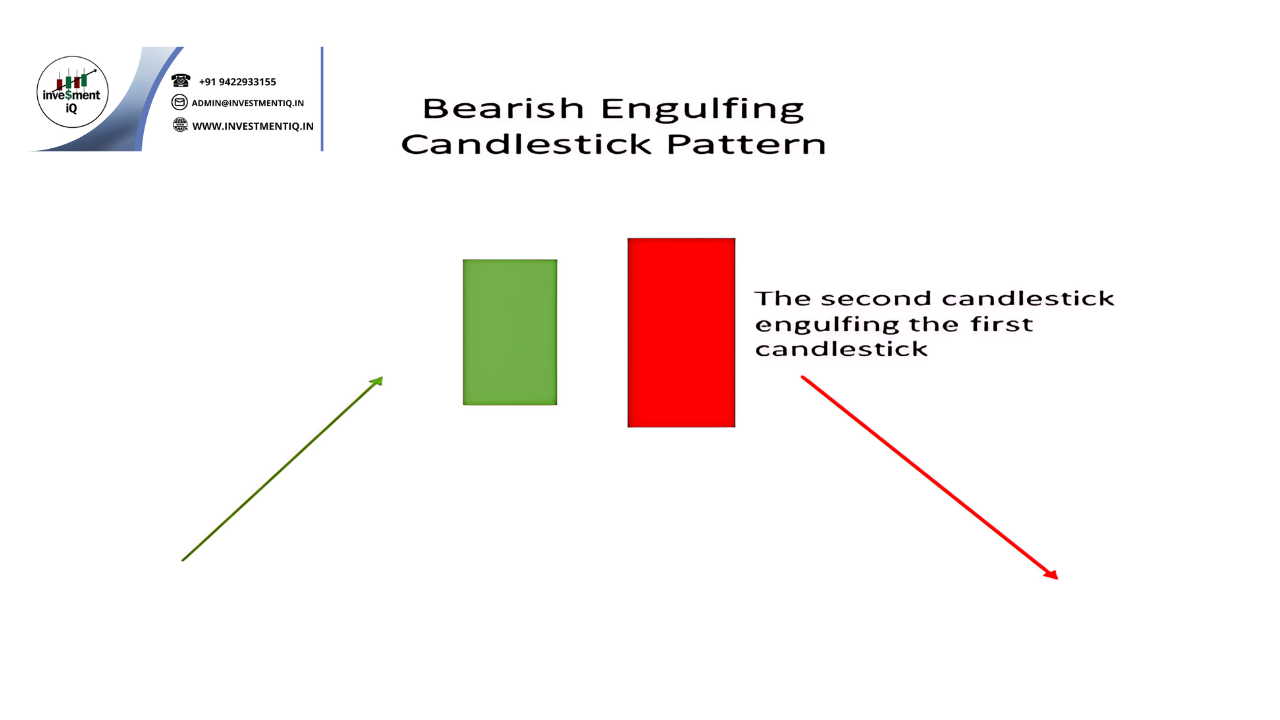
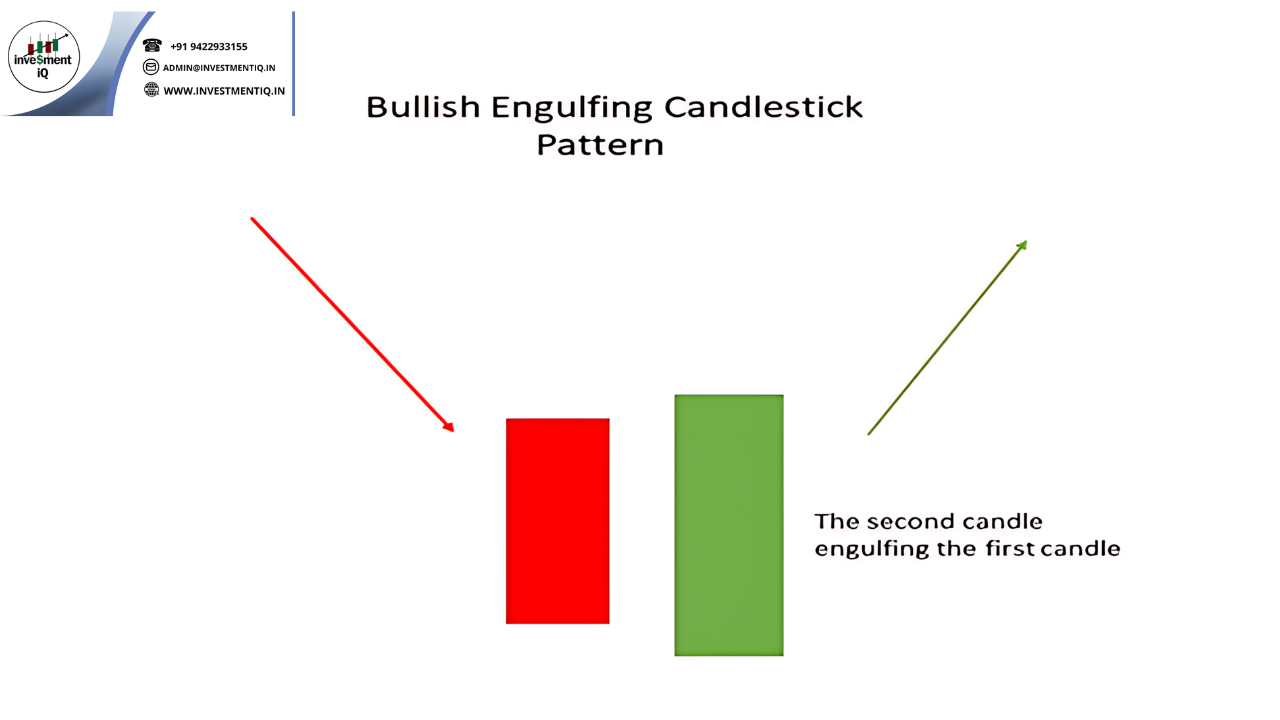
- Engulfing: A pattern where a larger candle engulfs the previous smaller candle, indicating a reversal.
Analyzing Candlestick Charts
Step-by-Step Approach:
- Identify Patterns: Look for specific candlestick patterns that indicate potential market reversals or continuations.
- Confirm with Volume: Higher volume on the pattern day strengthens its reliability.
- Use Technical Indicators: Combine candlestick patterns with indicators like moving averages, RSI, or MACD for better analysis.
- Set Trading Strategy: Based on the identified patterns, determine your entry and exit points, and set stop-loss levels to manage risk.
Example Scenario: Imagine you spot a Doji pattern after a strong uptrend. The next day, the stock opens lower, confirming the indecision and potential reversal. You decide to enter a short position, anticipating a decline.
Conclusion
Mastering the candlestick chart is essential for any trader looking to understand market movements. By learning to identify and analyze key patterns, you can enhance your trading strategy and make more informed decisions.
you may be interested in this blog here:-
Full Stack Development Salary in India – 2024 Trends and Insights
Salesforce Developer Salary in India An In-Depth Analysis
Ultimate Guide to UKG Math Worksheet PDF Free Download
Advanced OOP Concepts in SAP ABAP A Comprehensive Guide
Disclaimer: Investments in the securities market are subject to market risk, read all related documents carefully before investing.
