
Introduction
Candlestick Patterns are powerful tools for traders looking to predict market movements and make informed decisions. By analyzing the shapes and formations of candlesticks on a chart, traders can identify potential market reversals, trends, and continuations. This guide will explore various candlestick patterns and how you can leverage them for profitable trading.
What Are Candlestick Patterns?
Candlestick patterns are visual representations of price movements over time. Each candlestick typically represents one period of trading, such as an hour, a day, or a week. The candlestick’s body shows the opening and closing prices, while the wicks (or shadows) indicate the highest and lowest prices during that period.
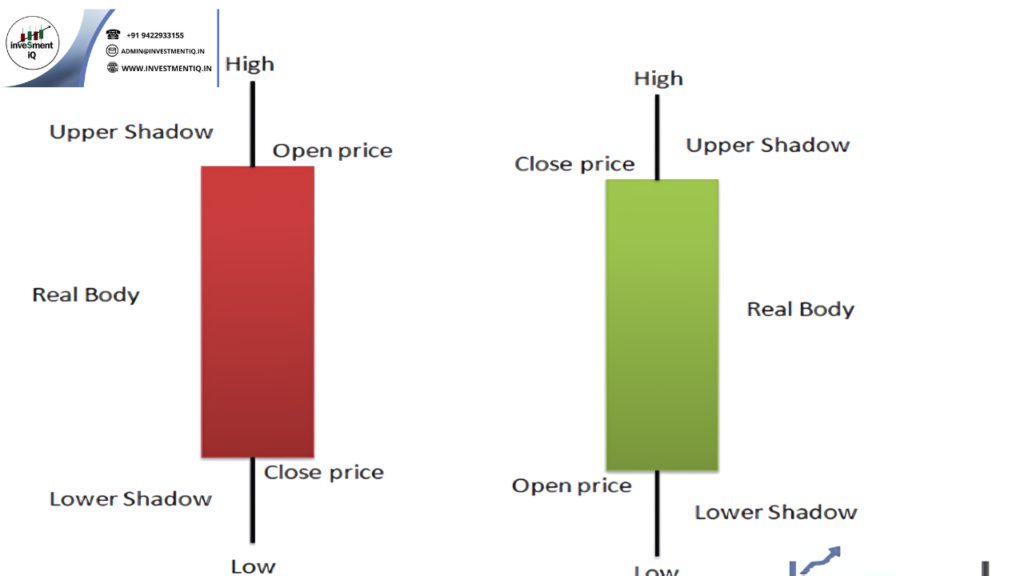
Key Elements of a Candlestick:
- Body: The rectangular part of the candlestick representing the open and close prices.
- Wicks/Shadows: The lines extending from the body, showing the high and low prices.
- Color: The color of the body indicates whether the close price was higher (bullish) or lower (bearish) than the open price.
Key Candlestick Patterns
Understanding these patterns can provide valuable insights into market sentiment and potential price movements.
- Doji Pattern The Doji candlestick has a small body with long wicks on either side, indicating market indecision. It signifies that neither buyers nor sellers were able to gain control during the period. A Doji can signal potential reversals or continuation of the current trend.
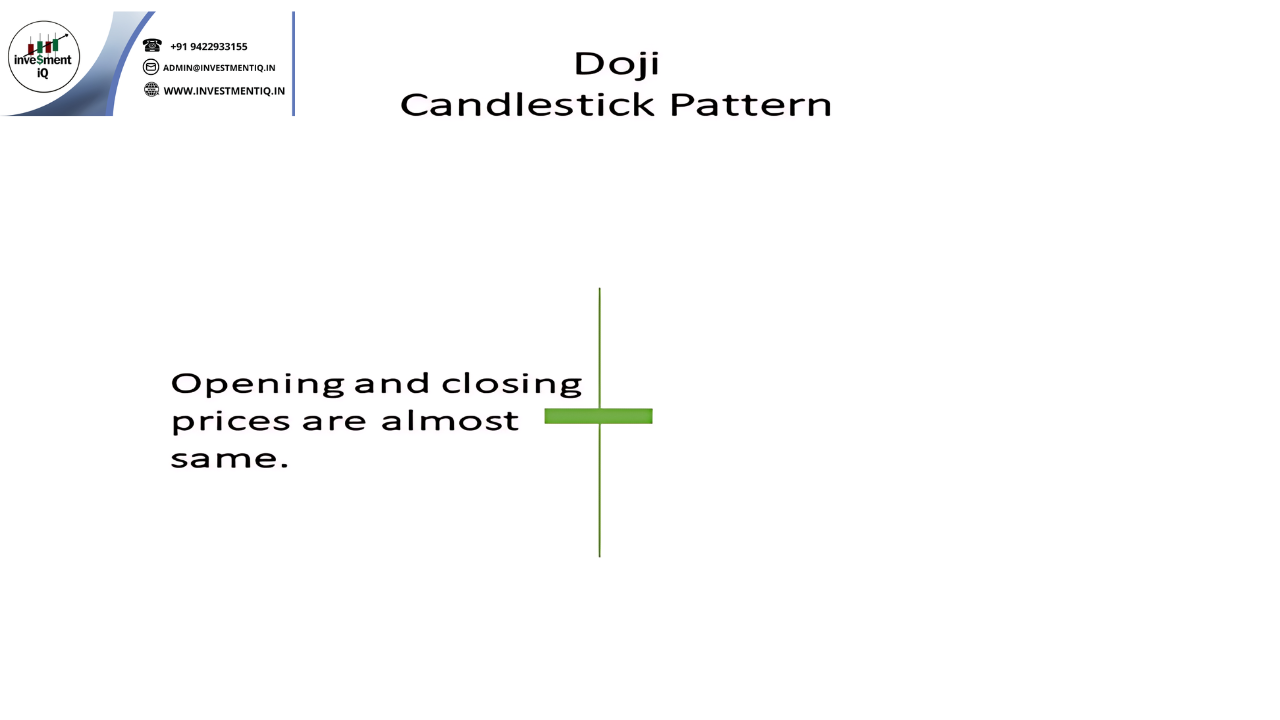
- Confirmation: Look for confirmation from other indicators or patterns before making trading decisions based on a Doji.
- Hammer Pattern The Hammer candlestick has a small body at the upper end of the trading range and a long lower wick. It appears after a downtrend and suggests a potential reversal.
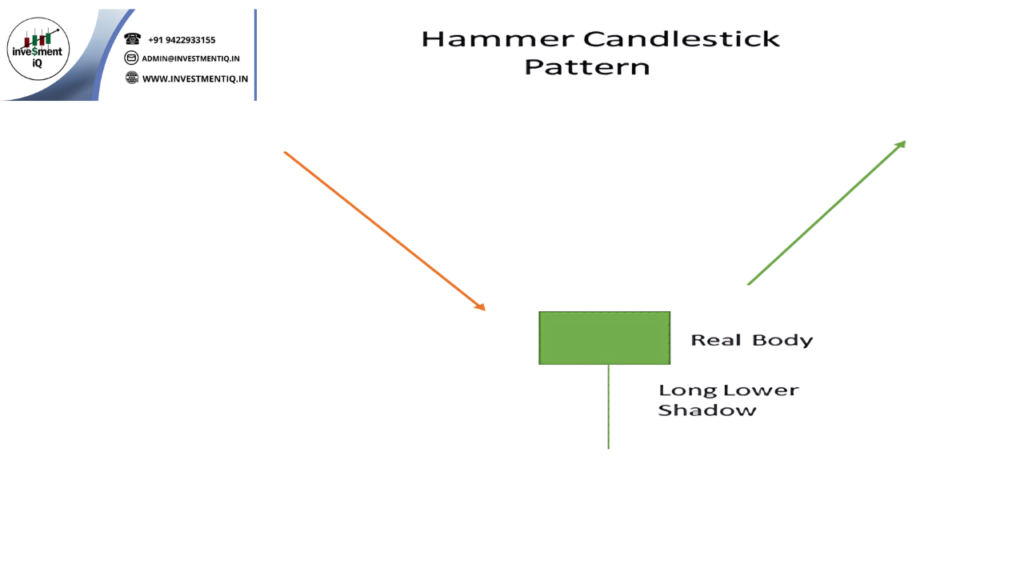
- Confirmation: Verify with subsequent bullish candlesticks or other indicators to confirm the reversal.
- Shooting Star Pattern The Shooting Star has a small body at the lower end of the trading range and a long upper wick. It indicates a potential bearish reversal after an uptrend.
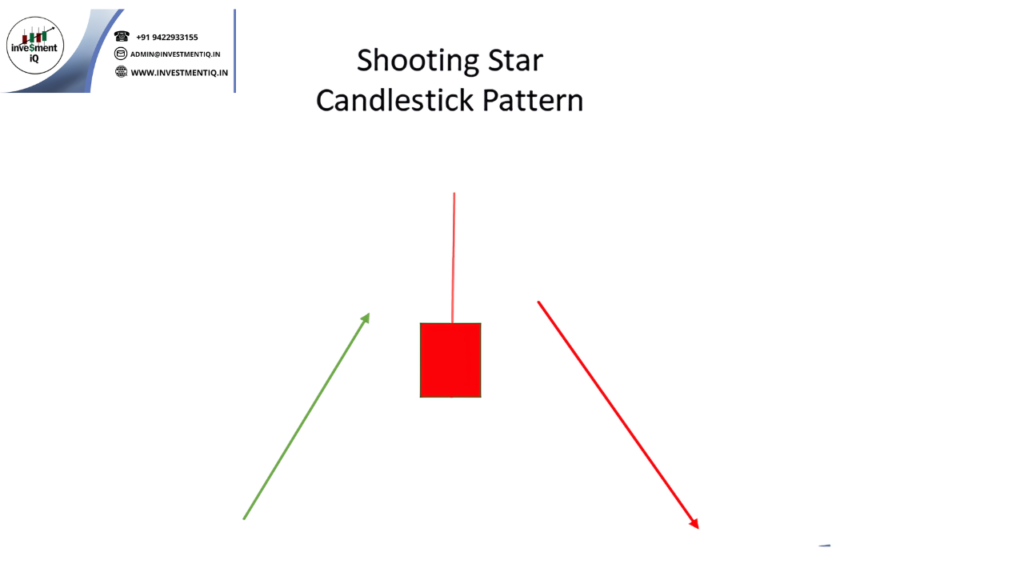
- Confirmation: Watch for confirmation from subsequent bearish candlesticks or volume analysis.
- Engulfing Pattern The Engulfing pattern involves two candlesticks. A Bullish Engulfing occurs when a small bearish candlestick is followed by a larger bullish candlestick that engulfs the previous one. Conversely, a Bearish Engulfing occurs after an uptrend, with a large bearish candlestick engulfing a smaller bullish one.
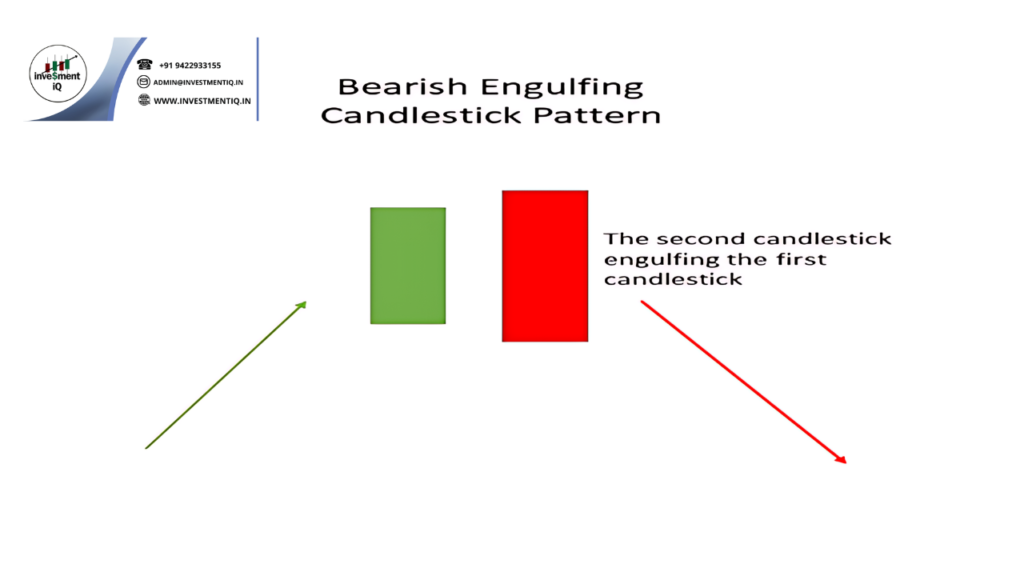
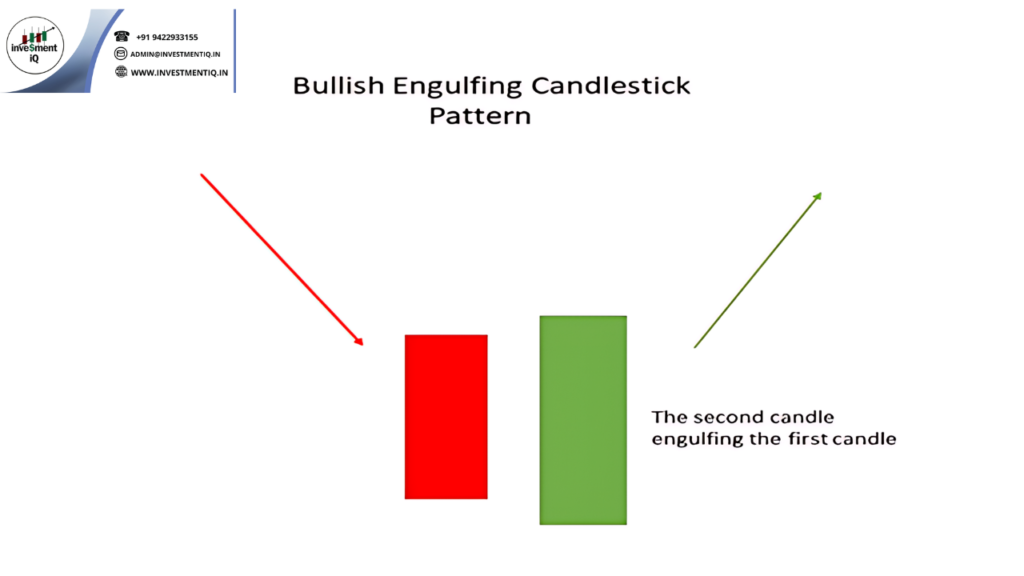
- Confirmation: Confirm with additional indicators or trend analysis.
- Morning Star and Evening Star Patterns The Morning Star is a three-candlestick pattern that signals a potential bullish reversal. It starts with a bearish candlestick, followed by a small-bodied candlestick (the star), and ends with a bullish candlestick. The Evening Star is the opposite and indicates a potential bearish reversal.
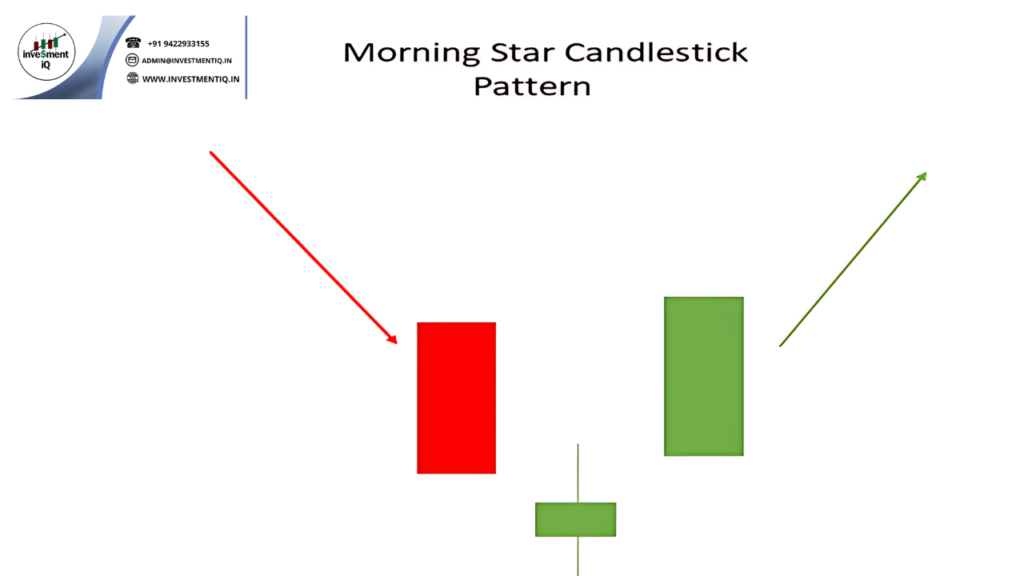
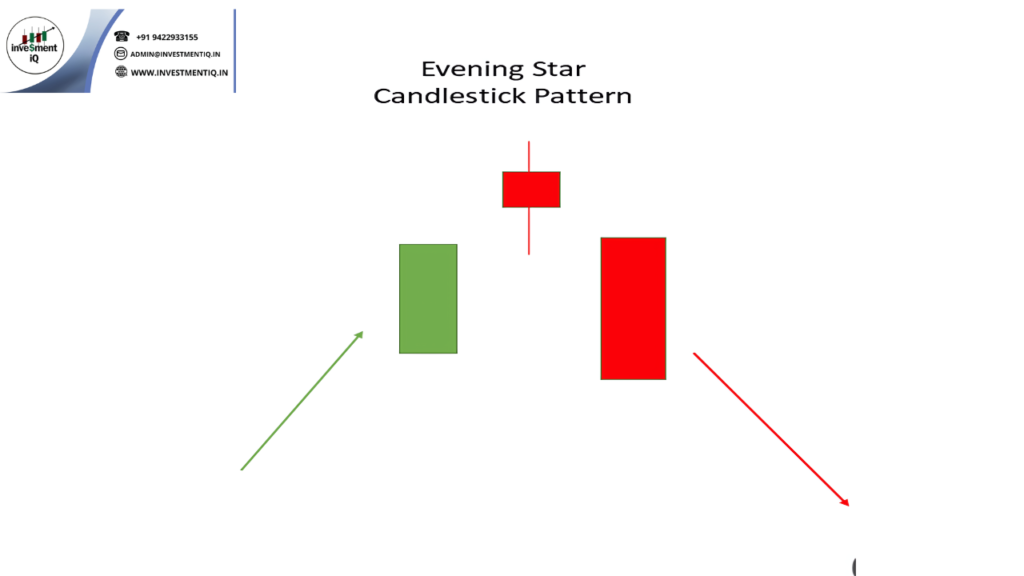
- Confirmation: Look for follow-through with subsequent candlesticks and volume.
How to Use Candlestick Patterns for Trading
Combining Patterns with Other Indicators: To enhance the reliability of candlestick patterns, combine them with other technical indicators like Moving Averages, Relative Strength Index (RSI), or Bollinger Bands. This multi-faceted approach provides a clearer picture of market conditions.
Setting Entry and Exit Points: Use candlestick patterns to set entry and exit points for trades. For instance, after identifying a Bullish Engulfing pattern, you might consider entering a trade when the next candlestick confirms the pattern.
Risk Management: Always implement proper risk management strategies. Set stop-loss orders to protect against unexpected market movements and manage your position size based on your risk tolerance.
Conclusion
Mastering candlestick patterns can significantly improve your trading strategy. By understanding and interpreting these patterns, you can make more informed decisions and potentially increase your profitability. Remember, practice and continuous learning are key to becoming proficient with candlestick analysis.
you may be interested in this blog here:-
Full Stack Development Salary in India – 2024 Trends and Insights
Salesforce Developer Salary in India An In-Depth Analysis
Ultimate Guide to UKG Math Worksheet PDF Free Download
Advanced OOP Concepts in SAP ABAP A Comprehensive Guide
